 Every month, I write a review of my portfolio of dividend growth (DG) stocks, DivGro. My goal with these reviews is to share updates to my portfolio and to detail the dividends I received during the month. Additionally, I look at how the month's activities have impacted DivGro's projected annual dividend income (PADI).
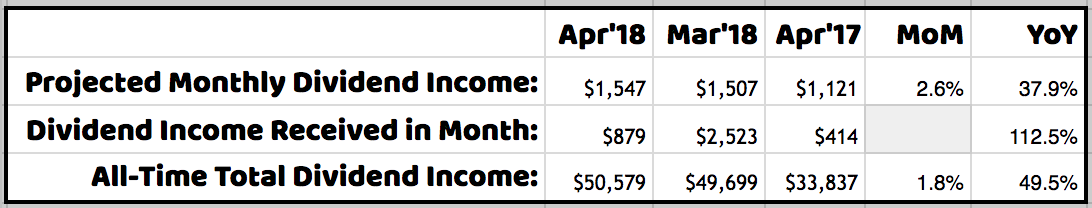
In April, I opened one new position and added shares to one existing position. Seven DivGro stocks announced dividend increases in April. The net result of these changes is that PADI increased by about 2.6% in April. Year over year, PADI increased by 37.9%.
As for dividend income, in April I received dividends totaling $879 from 16 stocks in my portfolio, a year over year increase of 112%. So far in 2018, I've collected $5,457 in dividends or about 30% of my 2018 goal of $18,000.

Dividend Income
I collected dividends totaling $879 from 16 different stocks in April:

- Blackstone Mortgage Trust (BXMT) — income of $186.00
- Chubb (CB) — income of $17.04
- Comcast (CMCSA) — income of $28.50
- Cisco Systems (CSCO) — income of $66.00
- Quest Diagnostics (DGX) — income of $6.25
- Eversource Energy (ES) — income of $30.30
- Hannon Armstrong Sustainable Infrastructure Capital (HASI) — income of $181.50
- Nuveen Floating Rate Income Fund (JFR) — income of $31.00
- Coca-Cola Company (The) (KO) — income of $78.00
- Main Street Capital (MAIN) — income of $85.50
- Altria (MO) — income of $52.50
- Nike (NKE) — income of $20.00
- Realty Income (O) — income of $16.46
- Travelers Companies (TRV) — income of $20.88
- Wal-Mart Stores (WMT) — income of $40.56
- Xcel Energy (XEL) — income of $19.00


Dividend Changes
In April, the following stocks announced dividend increases:
- International Business Machines (IBM) — increase of 4.67%
- Johnson & Johnson (JNJ) — increase of 7.14%
- Altria (MO) — increase of 6.06%
- Procter & Gamble Company (The) (PG) — increase of 4.00%
- Travelers Companies (TRV) — increase of 6.94%
- Xilinx (XLNX) — increase of 2.86%
- Exxon Mobil (XOM) — increase of 6.49%
I like seeing dividend increases above 7%, so seeing only one of the seven increases top my expectations is somewhat disappointing. However, the arithmetic average of this month's dividend increases is 5.45%, which still beats inflation.
Transactions
Here is a summary of my transactions in April:
- Lowe's Companies (LOW) — new position of 100 shares
- Altria (MO) — added 100 shares and increased position to 175 shares
LOW was ranked #1 in April's top-ranked DG stocks. In fact, the stock has made repeat appearances since December 2017 and finally traded below my fair value estimate of in April.
Because I like the stock, I sold a put in February with a strike price of $92.50 and an expiration date of 20 April 2018. Shortly thereafter, LOW's share price tumbled and the option moved in the money, finally being assigned four days before expiration day.
My cost basis for buying the 100 shares of LOW is $92.50 − ($196 − $0.79) ÷ 100 = $90.55. This is below my fair value estimate of $91, so from that perspective, I'm happy with the outcome.
Of course, LOW is trading well below my fair value estimate now, most recently at a price of $84.23 per share or a discount of about 7%. I'm thinking about lowering my cost basis by adding more shares.
I added 100 shares to my existing position in MO, also due to an options assignment.
On options expiration day, the April $60 put contracts I'd sold on MO were in the money. I decided to roll forward one put option and have the other one be assigned. Having received $70 in options premium, the cost basis for buying 100 shares of MO is $60 − ($72 − $0.54) ÷ 100 = $59.29 per share. (MO traded between $56.57 and $57.82 on April 20).
One of the risks of selling put options is that the share price could move below the strike price by the expiration date. When this happens, the option is in the money and will be assigned. That's why I only sell put options on stock I would like to own.
For details about my options trading, please see my latest options update.
Markets
I no longer compare DivGro's performance to those of the markets, but it is worth looking at the markets to understand the environment we're investing in:
| DOW 30 | S&P 500 | NASDAQ Composite | 10-YR BOND | CBOE VIX | |
| Mar 31, 2018 | 24,103.11 | 2,640.87 | 7,063.45 | 2.741% | 19.97 |
| Apr 30, 2018 | 24,163.15 | 2,648.05 | 7,066.27 | 2.936% | 15.93 |
In April, the DOW 30 gained 0.2%, the S&P 500 gained 0.3%, and the NASDAQ gained 0.0%. The yield on the benchmark 10-year Treasury note rose to 2.936%, while CBOE's measure of market volatility, the VIX decreased by 20.2%.
Portfolio Statistics
Given DivGro's current market value and the total capital invested, the portfolio has returned about 49% since inception. But calculating the IRR (internal rate of return) gives a better measure of portfolio performance, as IRR takes into account the timing and size of deposits since inception. DivGro's IRR is 15.2%.)
I track the yield on cost (YoC) for individual stocks, as well as an average YoC for my portfolio. DivGro's average YoC decreased from 4.16% last month to 4.12% this month.
Percentage payback relates dividend income to the amount of capital invested. DivGro's average percentage payback is 14.0%, up from last month's 13.9%.
Finally, projected annual yield is calculated by dividing PADI ($18,560) by the total amount invested. DivGro's projected annual yield is at 5.15%, up from last month's value of 5.04%.
Here's a chart showing DivGro's market value breakdown. Dividends are plotted at the base of the chart so we can see them grow over time:

Looking Ahead
I set a goal of increasing PADI to $18,500. It seems like that goal was way too conservative, as I've already achieved it! Before adjusting the goal, though, I'm planning on doing a risk assessment of the positions in my portfolio in the coming months. Based on my findings, I'm likely to make some changes that could reduce PADI. So, I'm keeping my PADI goal at $18,500 for now.
I'm hoping to increase the frequency of stock analysis articles in the coming months. The most recent article explains Why I Added Comcast To My Dividend Growth Portfolio. I'm aiming to do at least one stock analysis per month.
Please see my Performance page for various visuals summarizing DivGro's performance.
Thanks for reading and take care, everybody!
Impressive to see you are able to increase PADI with almost 38% with a portfolio of this size.
ReplyDeleteThanks, I Want Dividend -- the compounding force of reinvesting dividends and adding fresh capital monthly is starting to pay off!
DeleteWow This is amazing Ferdi. Congrats on the great progress and 112% growth rate. I love that you also crossed $50k in dividends received over your investing career. That is something to be very proud of. The addition of LOW and MO are just going to continue fueling your dividend growth for years to come. Keep hustling and keep up the great work.
ReplyDeleteBert
HI Bert, thanks for your comment!
DeleteThanks for pointing out the milestone of crossing the $50k mark in total dividends. It slipped my mind to mention it. I'm very happy with DivGro's progress over the years; it has succeeded beyond what I'd imagined when I started!
Take care and happy investing!
Hey mate, just purely out of curiosity, have you beaten SP500 since starting your investment journey?
ReplyDeleteI admire your trades and your consistency on giving us regular updates. Was very curious about your portfolio v SP500.
Thanks for the question, Anonymous.
DeleteI no longer do those comparisons. Frankly, I'm probably not beating the S&P 500 performance-wise. But my dividend income is growing and delivering more than I would get from investing in an S&P 500 index-tracking fund. The S&P 500 yields 1.88% currently:
(http://www.multpl.com/s-p-500-dividend-yield/table?f=m).
DivGro's yield on cost is 4.12%.