
Welcome to the monthly review of DivGro, my portfolio of dividend growth stocks.
The goal of these monthly reviews is to share updates I've made to the portfolio and to provide a summary of dividends collected. I also look at how DivGro's projected annual dividend income (PADI) has changed.
In June, I added shares to three existing positions and eight DivGro stocks announced dividend increases. The net result of these changes is that PADI increased by about 1.1% in June. Year over year, PADI increased by 28.1%.
As for dividend income, in June I received dividends totaling $5,678 from 51 stocks in my portfolio, a year-over-year increase of 7%. So far in 2022, I've collected $24,267 in dividends, or about 56% of my 2022 goal of $43,200.
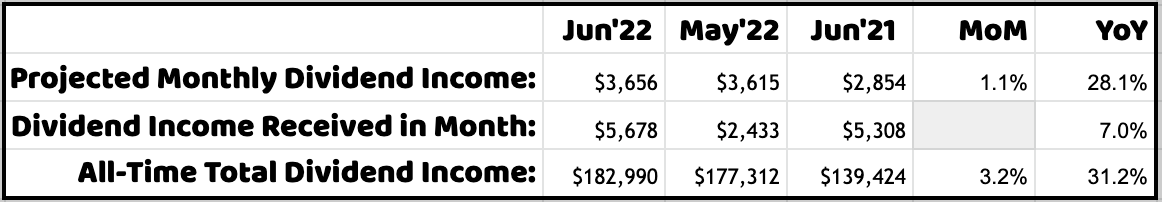
DivGro's PADI of $43,874 means I can expect to receive $3,656 in dividend income per month, on average, in perpetuity, assuming the status quo is maintained. But DivGro's PADI should increase over time because I invest in dividend growth stocks. Furthermore, I plan to reinvest dividends until I retire, so DivGro's PADI should continue to grow through dividend growth and through compounding.
Dividend Income
In June, I received a total of $5,678 in dividend income from 51 different stocks:
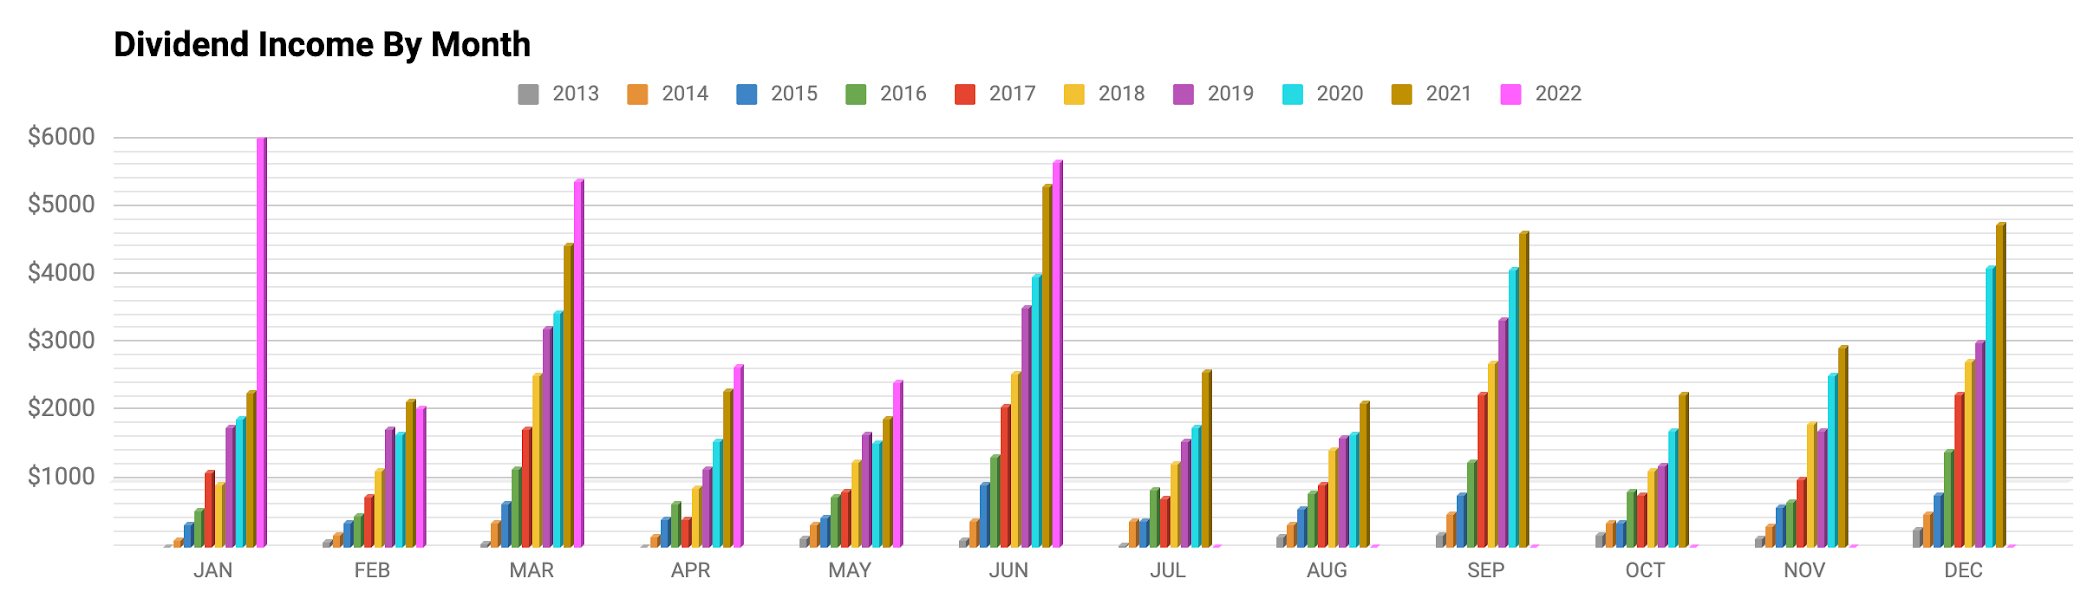
Here is a list of the dividends I received in June:
- Archer-Daniels-Midland Company (ADM) — income of $80.00
- Aflac Incorporated (AFL) — income of $80.00
- Virtus AllianzGI Artificial Intelligence & Technology Opportunities Fund (AIO) — income of $120.00
- Amgen Inc (AMGN) — income of $223.10
- Atmos Energy Corporation (ATO) — income of $136.00
- Broadcom Inc (AVGO) — income of $123.00
- American States Water Company (AWR) — income of $67.53
- BlackRock, Inc (BLK) — income of $170.80
- BlackRock Science and Technology Trust (BST) — income of $100.00
- Cummins Inc (CMI) — income of $72.50
- Canadian National Railway Company (CNI) — income of $71.08
- Cintas Corporation (CTAS) — income of $9.50
- Chevron Corporation (CVX) — income of $213.00
- Digital Realty Trust, Inc (DLR) — income of $54.90
- Anthem, Inc (ELV) — income of $12.80
- Enbridge Inc (ENB) — income of $204.00
- Eaton Vance Tax-Advantaged Global Dividend Opportunities Fund (ETO) — income of $224.00
- Eaton Vance Tax-Advantaged Dividend Income Fund (EVT) — income of $203.25
- Gilead Sciences, Inc (GILD) — income of $146.00
- The Home Depot, Inc (HD) — income of $133.00
- Honeywell International Inc (HON) — income of $68.60
- International Business Machines Corporation (IBM) — income of $165.00
- Intercontinental Exchange, Inc (ICE) — income of $38.00
- Intel Corporation (INTC) — income of $73.00
- Johnson & Johnson (JNJ) — income of $142.38
- Lockheed Martin Corporation (LMT) — income of $112.00
- Main Street Capital (MAIN) — income of $75.40
- McDonald's Corporation (MCD) — income of $69.00
- 3M Company (MMM) — income of $111.75
- Microsoft Corporation (MSFT) — income of $62.00
- NextEra Energy, Inc (NEE) — income of $42.50
- Virtus AllianzGI Equity & Convertible Income Fund (NIE) — income of $625.00
- Northrop Grumman Corporation (NOC) — income of $69.20
- Realty Income Corporation (O) — income of $37.05
- Public Service Enterprise Group Incorporated (PEG) — income of $135.00
- PepsiCo, Inc (PEP) — income of $69.00
- Pfizer Inc (PFE) — income of $80.00
- Pinnacle West Capital Corporation (PNW) — income of $212.50
- Public Storage (PSA) — income of $120.00
- QUALCOMM Incorporated (QCOM) — income of $52.50
- Raytheon Technologies Corporation (RTX) — income of $55.00
- Snap-on Incorporated (SNA) — income of $85.20
- The TJX Companies, Inc (TJX) — income of $29.50
- T Rowe PriceT. Rowe Price Group, Inc (TROW) — income of $120.00
- The Travelers Companies, Inc (TRV) — income of $93.00
- Tyson Foods, Inc (TSN) — income of $69.00
- UnitedHealth Group Incorporated (UNH) — income of $99.00
- Union Pacific Corporation (UNP) — income of $62.40
- United Parcel Service, Inc (UPS) — income of $76.00
- Visa Inc (V) — income of $37.50
- Valero Energy Corporation (VLO) — income of $147.00
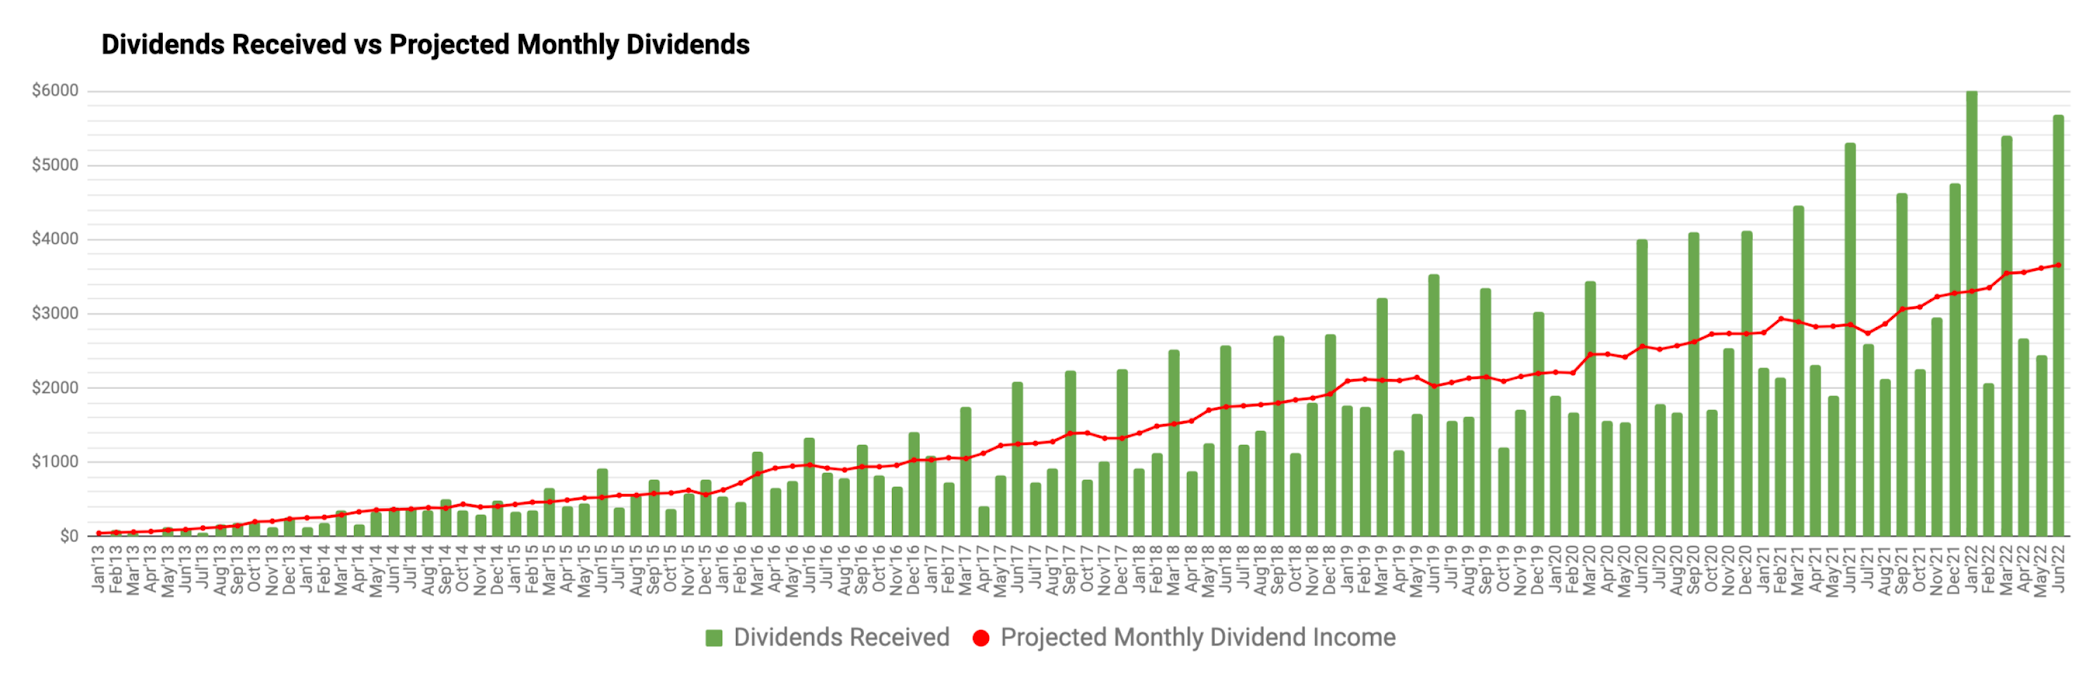
The following chart shows DivGro's monthly dividends plotted against PMDI. Quarter-ending months are huge outliers:
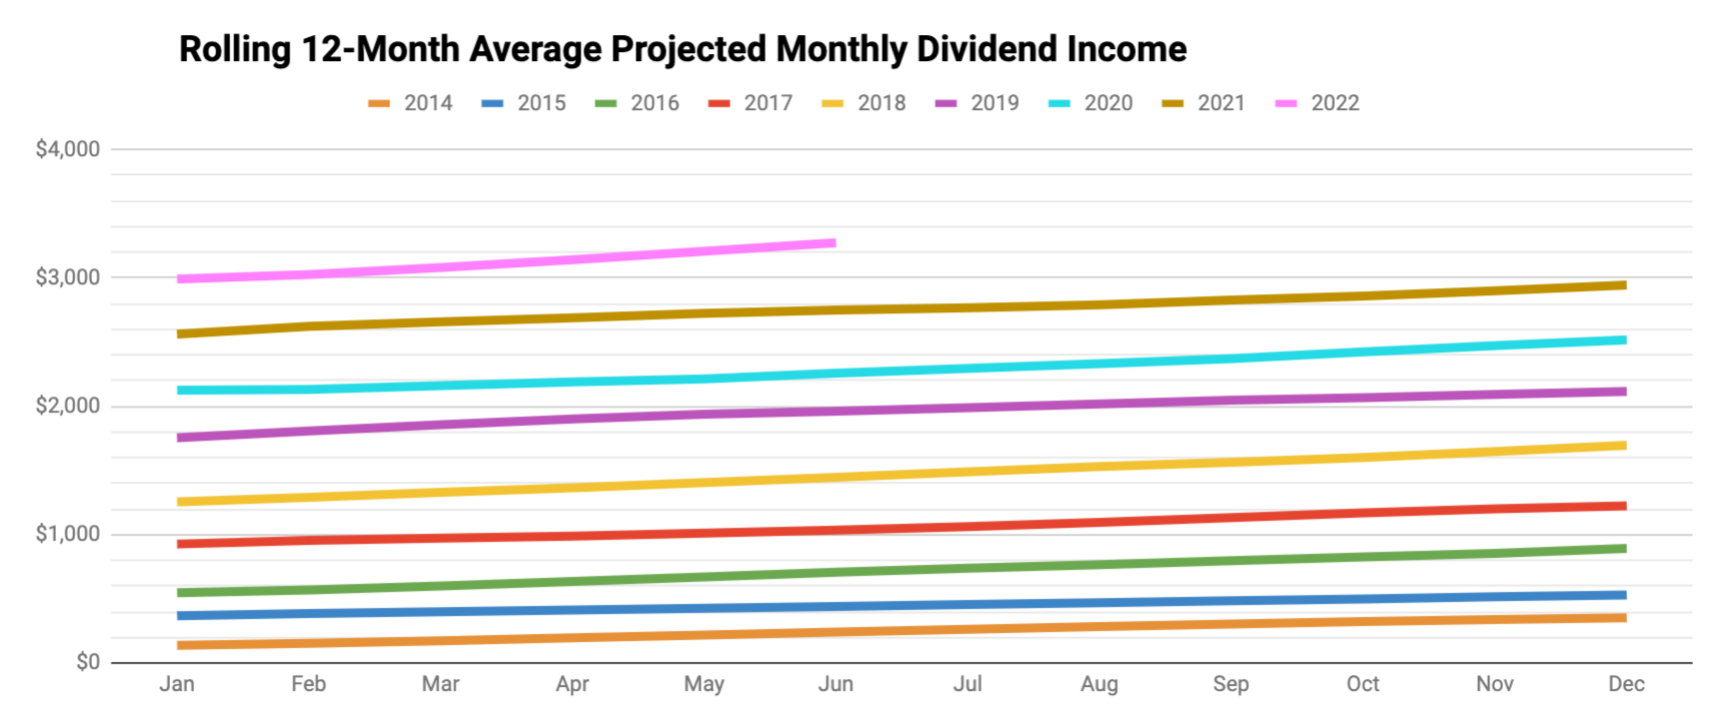
This is one reason that I now create a rolling 12-month average of dividends received (the orange bars) plotted against a rolling 12-month average of PMDI (the blue, staggered line):
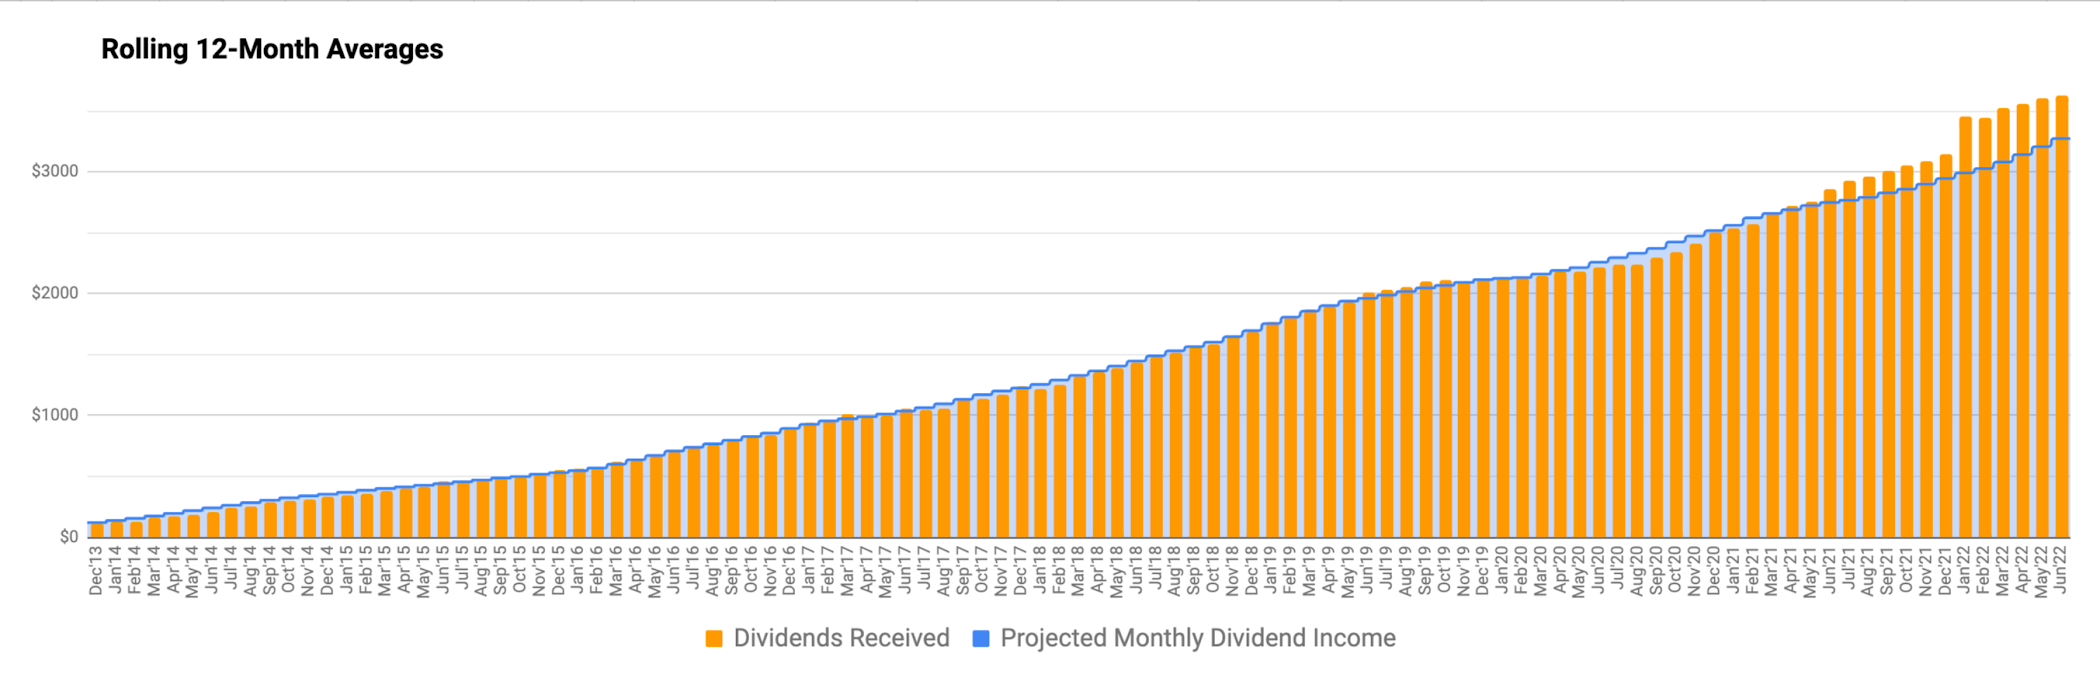
Dividends received are outpacing the rolling 12-month average of PMDI because of special dividends.
Dividend Changes
In June, the following stocks announced dividend increases or paid higher dividends due to exchange-rate fluctuations::
- Enbridge Inc (ENB) — increase of 0.59%
- Northrop Grumman Corporation (NOC) — increase of 10.19%
- Realty Income Corporation (O) — increase of 0.20%
- PepsiCo, Inc (PEP) — increase of 6.98%
- QUALCOMM Incorporated (QCOM) — increase of 10.29%
- The TJX Companies, Inc (TJX) — increase of 13.46%
- UnitedHealth Group Incorporated (UNH) — increase of 13.79%
- W. P. Carey Inc (WPC) — increase of 0.19%
The following stock paid lower dividends due to exchange-rate fluctuations::
- Canadian National Railway Company (CNI) — decrease of 3.03%
These changes will increase DivGro's PADI by about $123.
I like seeing dividend increases above 7% and four of the eight increases are above 7%. The arithmetic average of this month's dividend increases is 5.9%, which, unfortunately, is below the current rate of inflation.
Transactions
Here is a summary of my transactions in June:
- Comcast Corporation (CMCSA) — added 150 shares and increased position to 450 shares
- Cisco Systems, Inc (CSCO) — added 60 shares and increased position to 300 shares
- Texas Instruments Incorporated (TXN) — added 25 shares and increased position to 100 shares
These transactions increased DivGro's PADI by about $368.
Recently, I picked my top dividend growth stocks in each GICS sector, and both CMCSA and TXN made the list. With these buys, my positions now are full-sized positions.Portfolio Diversification
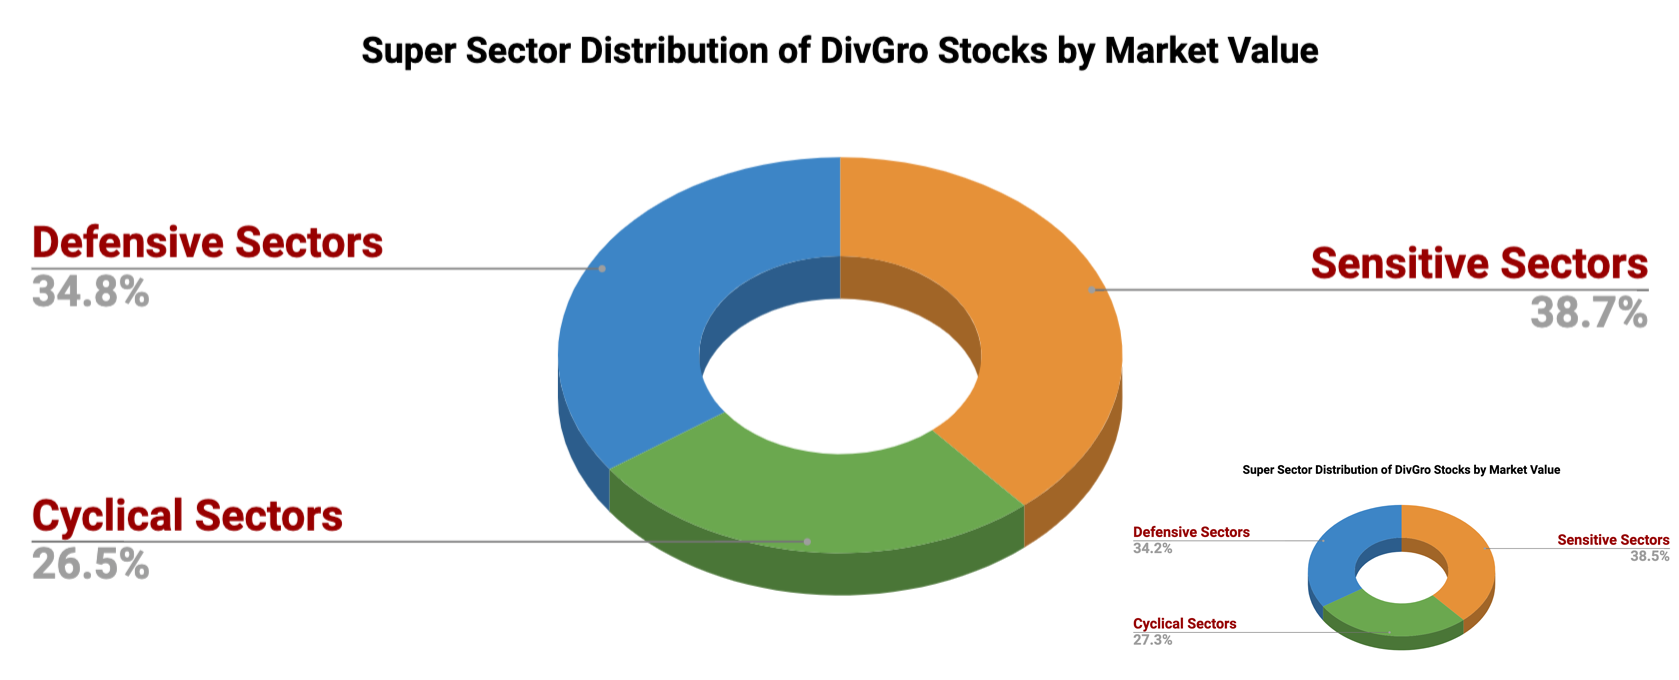
I'm continuing to slowly rebalance DivGro between Defensive, Sensitive, and Cyclical supersectors. Below is a chart showing the current distribution with an insert of last month's distribution.
Markets
It is worth looking at the markets to understand the environment we're investing in:
|
DOW 30 |
S&P 500 |
NASDAQ Composite |
10-YR BOND |
CBOE VIX |
|
| May 31, 2022 | 32,990.12 | 4,132.15 | 12,081.39 | 2.844 | 26.19 |
| Jun 30, 2022 | 30,775.43 | 3,785.38 | 11,028.74 | 2.972 | 28.71 |
In June, the DOW 30 dropped 6.7%, the S&P 500 dropped 8.4%, and the NASDAQ dropped 8.7%. The yield on the benchmark 10-year Treasury note rose to 2.972, while CBOE's measure of market volatility, the VIX, increased by 9.6% to 28.71.
Following is a chart showing how the stocks and funds in DivGro performed over the past month:

It is satisfying to see that DivGro outperformed the S&P 500 in June, even though a "performance" of -6.27% is nothing to be thrilled about. I should point out that this comparison is a price-performance comparison only and does not account for dividends. DivGro's position-weighted average yield is 3.11% whereas, in 2021, the S&P 500's yield was only 1.3%.
DivGro outperformed the S&P 500 on a trailing twelve-month basis, with negative returns of 2.4% versus negative returns of 11.8% for the S&P 500!

Portfolio Statistics
Based on the total capital invested and the portfolio's current market value, DivGro has delivered a simple return of about 109% since inception. In comparison, DivGro's IRR (internal rate of return) is 14.1%. (IRR takes into account the timing and size of deposits since inception, so it is a better measure of portfolio performance).
I track the yield on cost (YoC) for individual stocks, as well as an average YoC for my portfolio. DivGro's average YoC decreased from 4.17% last month to 4.16% this month.
Another interesting statistic is percentage payback, which relates dividend income to the amount of capital invested. DivGro's average percentage payback is 28.8%, up from last month's 28.4%.
Finally, DivGro's projected annual yield is at 6.90%, down from last month's value of 6.92%. I calculate projected annual yield by dividing PADI ($43,874) by the total amount invested.
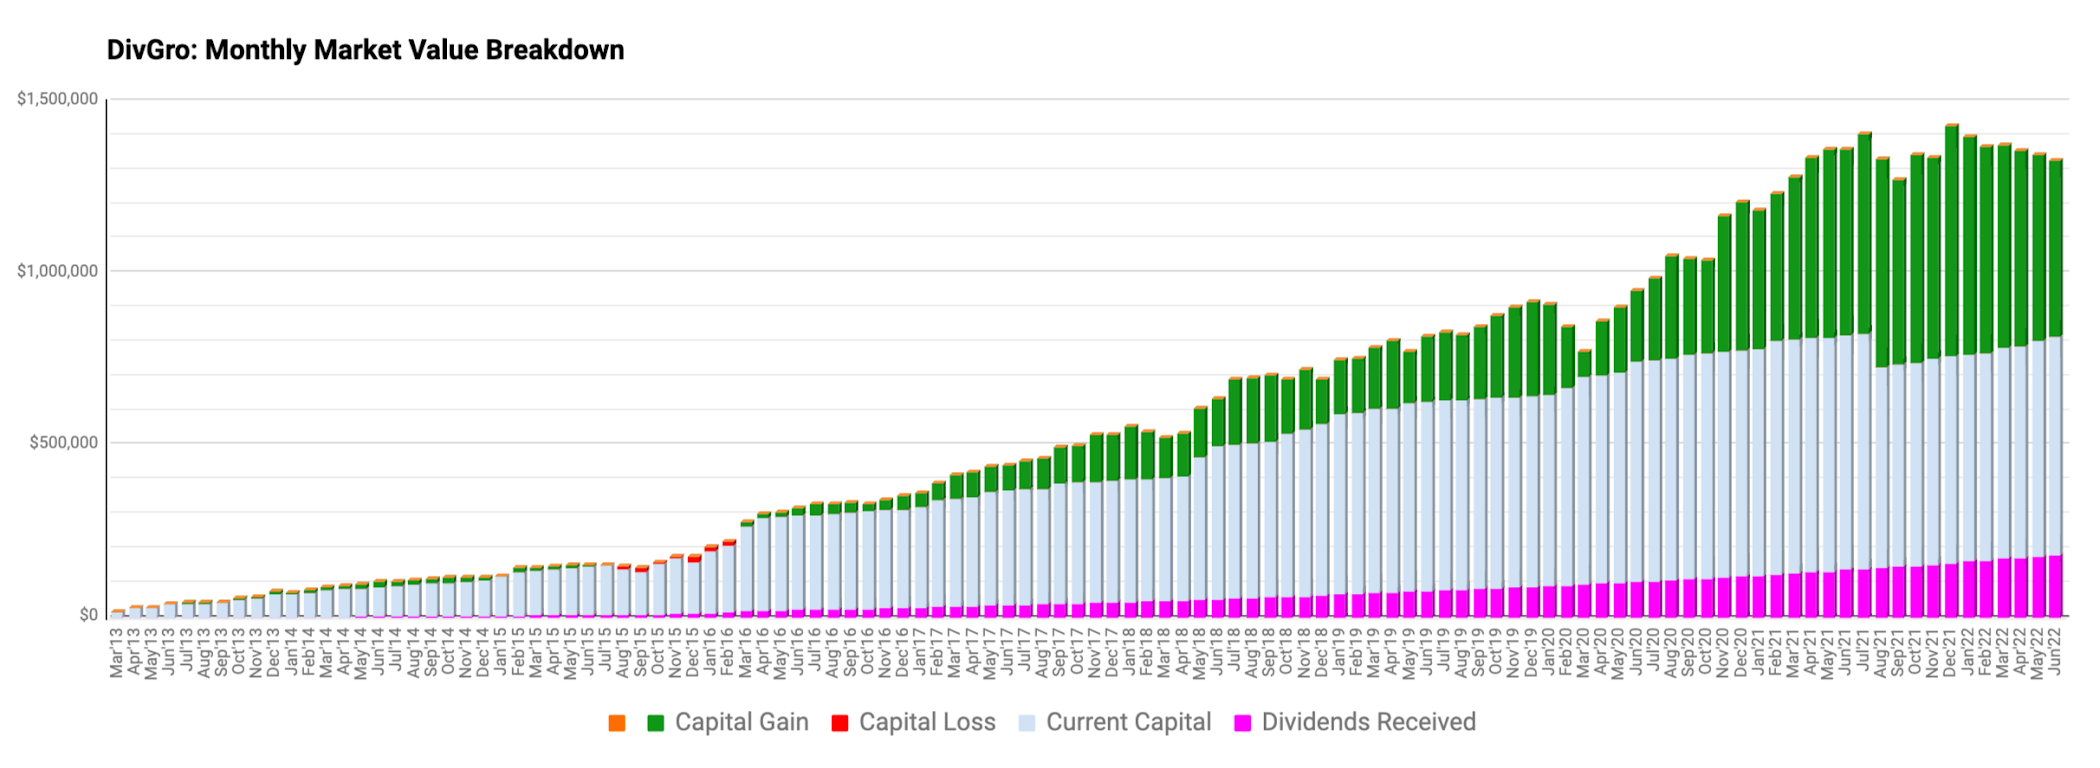
The following chart shows DivGro's market value breakdown. Dividends are plotted at the base of the chart so we can see them grow over time:
Looking Ahead
We're in a bear market now and I'm wondering how long this one will last. DivGro is outperforming the S&P 500, so my efforts over the past year or so to make DivGro more defensive are paying off!
Shortly, I'll write my 38th quarterly report!
Only six more months and then I'll complete 10 years of blogging about DivGro!
Please see my Performance page for various visuals summarizing DivGro's performance.
You can now follow me on Twitter and Facebook.
No comments :
Post a Comment
Please don't include links in comments. I will mark such comments as spam and the comment won't be published. To make me aware of your blog or website, comment on my Blogrole page instead.