
Every month, I write a review of my portfolio of dividend growth stocks, DivGro. I provide a summary of transactions and dividends received in the past month. I also consider the impact on DivGro's projected annual dividend income (PADI).
In July, I executed several trades to consolidate positions, mainly to have like lots in the same accounts. DivGro is spread across five different accounts, and I wanted to hold each ticker in only one account rather than in multiple accounts.
Eight DivGro stocks announced dividend increases in July.
The net result of these changes is that PADI increased by about 2.3% in July.
Year over year, PADI increased by 36.7%.
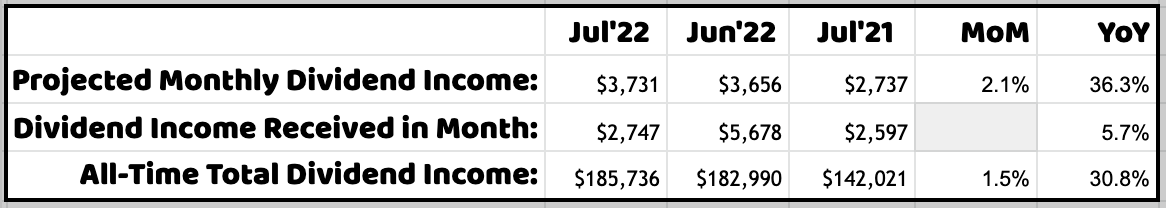
DivGro's PADI of $44,900, means I can expect to receive $3,742 in dividend income per month, on average, in perpetuity, assuming the status quo is maintained. But DivGro's PADI should increase over time because I invest in dividend growth stocks. Furthermore, I plan to reinvest dividends until I retire, so DivGro's PADI should continue to grow through dividend growth and through compounding.
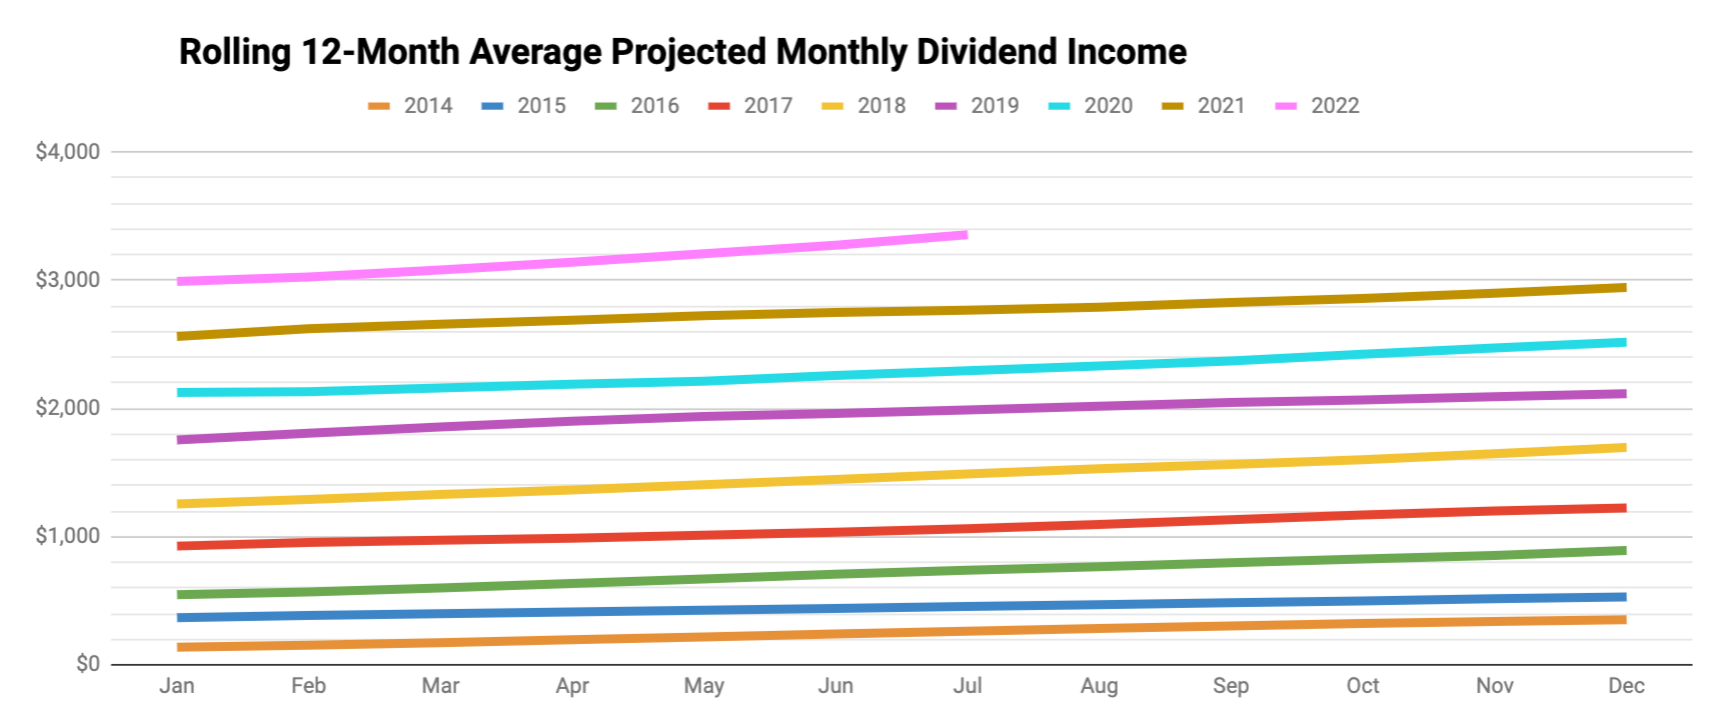
The above chart presents a rolling 12-month average of DivGro's projected monthly dividend income. I'm very close to achieving my 2022 goal of increasing PADI to $45,000:

Dividend Income
In July, I received a total of $2,747 in dividend income from 29 different stocks:
Here is a list of the dividends I collected in July:
- Automatic Data Processing, Inc (ADP) — income of $104.00
- Virtus AllianzGI Artificial Intelligence & Technology Opportunities Fund (AIO) — income of $120.00
- The Allstate Corporation (ALL) — income of $85.00
- American Tower Corporation (AMT) — income of $14.30
- Franklin Resources, Inc (BEN) — income of $87.00
- The Bank of Nova Scotia (BNS) — income of $119.80
- BlackRock Science and Technology Trust (BST) — income of $100.00
- Chubb Limited (CB) — income of $83.00
- Comcast Corporation (CMCSA) — income of $121.50
- Cisco Systems, Inc (CSCO) — income of $114.00
- DTE Energy Company (DTE) — income of $88.50
- Eaton Vance Tax-Advantaged Global Dividend Opportunities Fund (ETO) — income of $224.00
- Eaton Vance Tax-Advantaged Dividend Income Fund (EVT) — income of $203.25
- FedEx Corporation (FDX) — income of $57.50
- Illinois Tool Works Inc (ITW) — income of $73.20
- The Coca-Cola Company (KO) — income of $88.00
- Main Street Capital (MAIN) — income of $55.90
- Mondelez International, Inc. (MDLZ) — income of $70.00
- Medtronic plc (MDT) — income of $68.00
- Altria Group, Inc (MO) — income of $207.00
- Merck & Co., Inc (MRK) — income of $138.00
- NIKE, Inc (NKE) — income of $4.58
- Realty Income Corporation (O) — income of $37.13
- Oracle Corporation (ORCL) — income of $48.00
- Philip Morris International Inc (PM) — income of $150.00
- Sempra (SRE) — income of $91.60
- Stryker Corporation (SYK) — income of $6.95
- W. P. Carey Inc (WPC) — income of $105.90
- Xcel Energy Inc (XEL) — income of $80.44
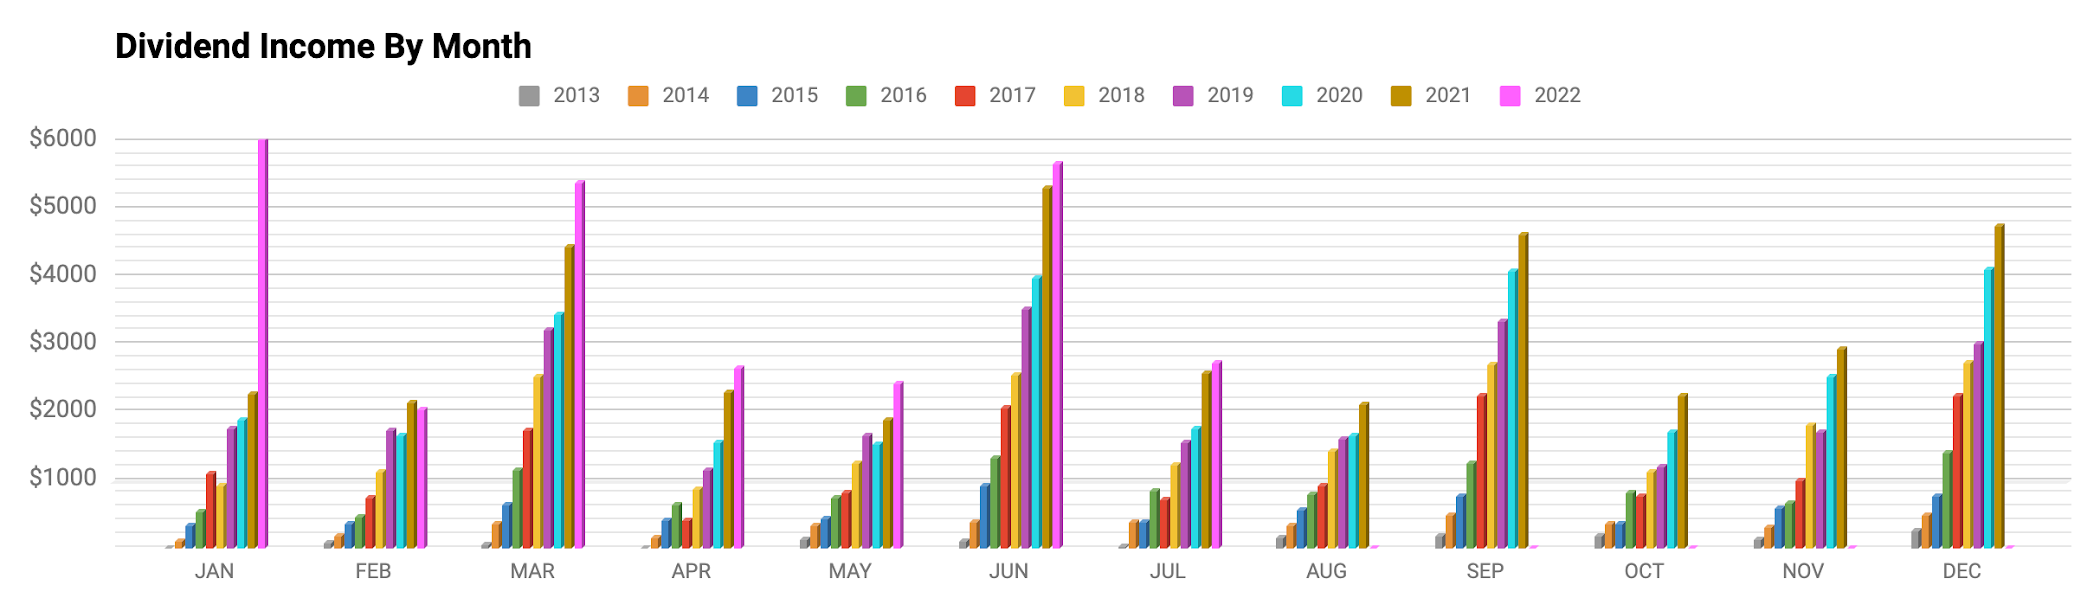
The chart below shows DivGro's monthly dividends plotted against PMDI. Clearly, quarter-ending months are huge outliers:
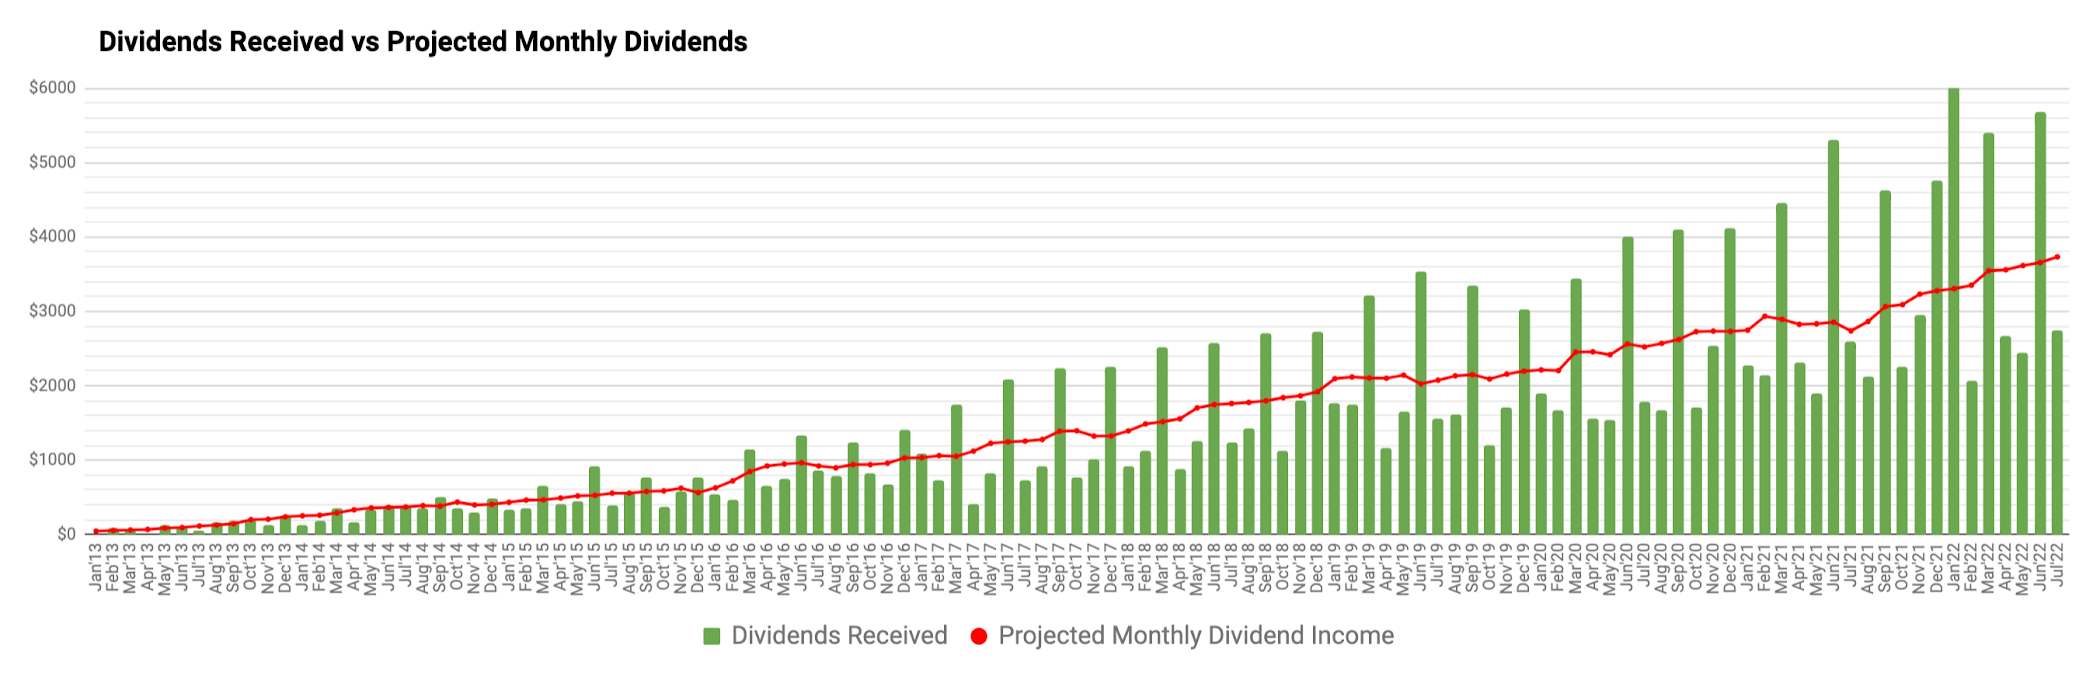
This is one reason that I create a rolling 12-month average of dividends received (the orange bars) plotted against a rolling 12-month average of PMDI (the blue, staggered line):
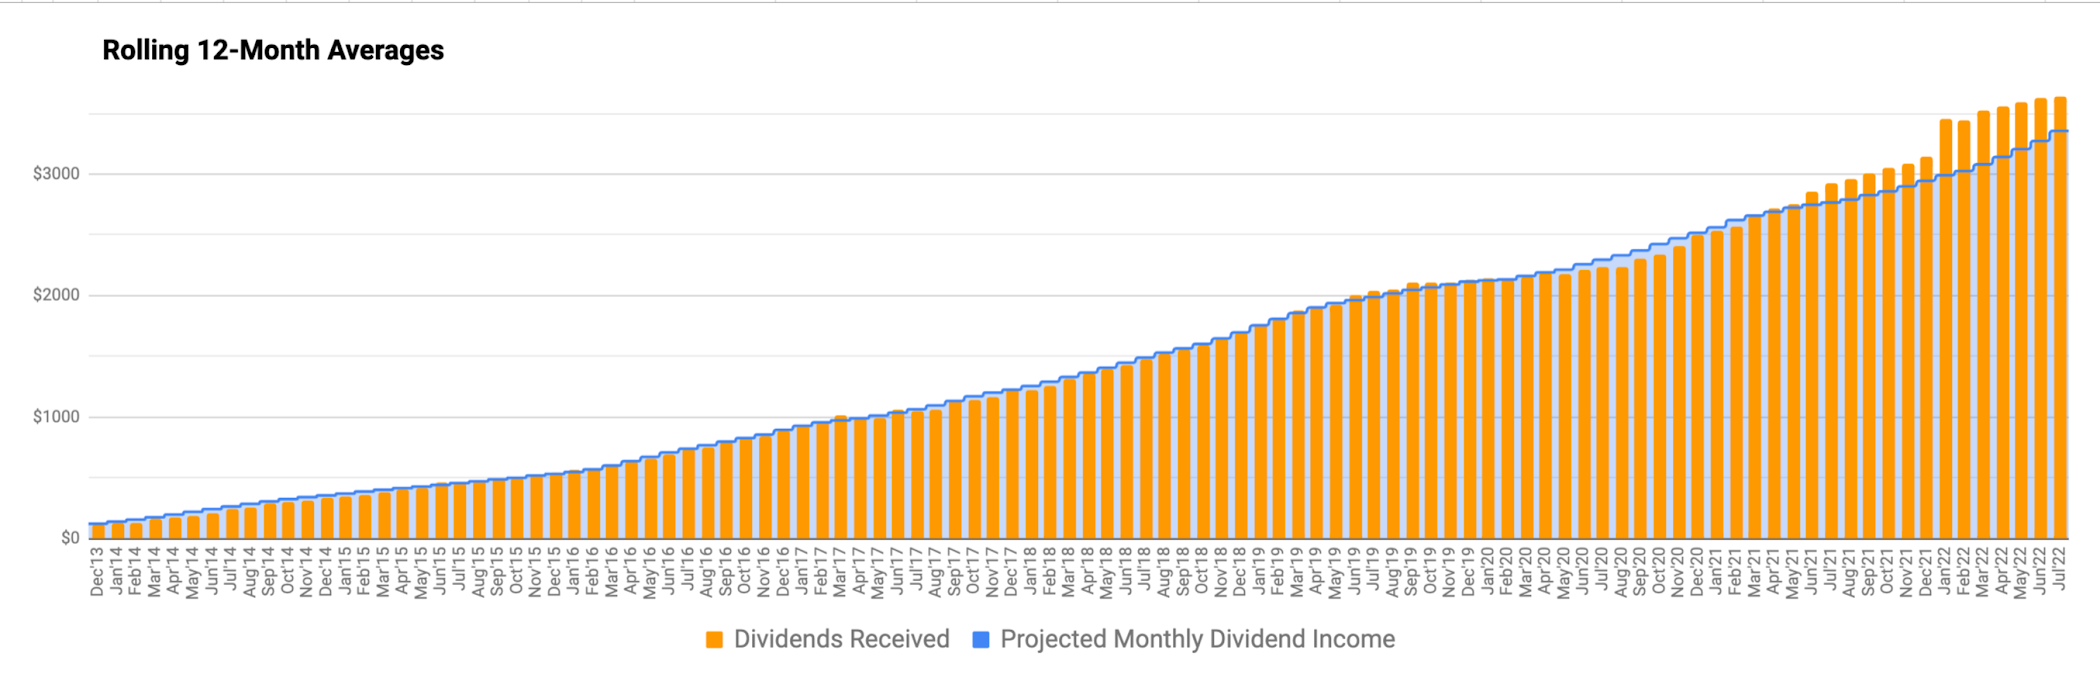
While it would be nicer if dividends were distributed more evenly, it is not something that would drive my investment decisions.
Dividend Changes
In July, the following stocks announced dividend increases or paid higher dividends (perhaps due to exchange rate fluctuations):
- American Tower Corporation (AMT) — increase of 2.14%
- American States Water Company (AWR) — increase of 8.90%
- The Bank of Nova Scotia (BNS) — increase of 2.59%
- Cummins Inc (CMI) — increase of 8.28%
- Cintas Corporation (CTAS) — increase of 21.05%
- FedEx Corporation (FDX) — increase of 53.33%
- Mondelez International, Inc. (MDLZ) — increase of 10.00%
- National Retail Properties, Inc (NNN) — increase of 3.77%
As a result of these changes, DivGro's PADI will increase by $219.
I like seeing dividend increases above 7%, and five of the eight increases this month top my expectations. The arithmetic average of this month's dividend increases is 13.8%, which easily beats inflation!
Transactions
Here is a summary of my transactions in July:
- Sempra (SRE) — new position of 80 shares
- Sempra (SRE) — sold -50 shares and closed position
- American States Water Company (AWR) — added 115 shares and increased position to 200 shares
- Cummins Inc (CMI) — added 50 shares and increased position to 100 shares
- The Home Depot, Inc (HD) — added 30 shares and increased position to 100 shares
- Honeywell International Inc (HON) — added 30 shares and increased position to 100 shares
- Intel Corporation (INTC) — added 100 shares and increased position to 200 shares
- Illinois Tool Works Inc (ITW) — added 40 shares and increased position to 100 shares
- QUALCOMM Incorporated (QCOM) — added 30 shares and increased position to 100 shares
- Starbucks Corporation (SBUX) — added 60 shares and increased position to 200 shares
- Verizon Communications Inc (VZ) — added 150 shares and increased position to 400 shares
- American States Water Company (AWR) — sold -100 shares and reduced position to 85 shares
- Cisco Systems, Inc (CSCO) — sold -100 shares and reduced position to 200 shares
- Intel Corporation (INTC) — sold -100 shares and reduced position to 100 shares
- Johnson & Johnson (JNJ) — sold -50 shares and reduced position to 76 shares
- National Retail Properties, Inc (NNN) — sold -25 shares and reduced position to 200 shares
- Public Storage (PSA) — sold -15 shares and reduced position to 45 shares
- Tyson Foods, Inc (TSN) — sold -50 shares and reduced position to 100 shares
- UnitedHealth Group Incorporated (UNH) — sold -20 shares and reduced position to 40 shares
These transactions increased DivGro's PADI by about $807.
The majority of these transactions were consolidation-style transactions. DivGro is spread over five different accounts, and I wanted to have positions in a single account rather than have lots spread over multiple accounts.Portfolio Diversification


Markets
It is worth looking at the markets to understand the environment we're investing in:
|
DOW 30 |
S&P 500 |
NASDAQ Composite |
10-YR BOND |
CBOE VIX |
|
| Jun 30, 2022 | 30,775.43 | 3,785.38 | 11,028.74 | 2.972 | 28.71 |
| Jul 31, 2022 | 32,845.13 | 4,130.29 | 12,390.69 | 2.642 | 21.33 |
In July, the DOW 30 gained 6.7%, the S&P 500 gained 9.1%, and the NASDAQ gained 12.3%. The yield on the benchmark 10-year Treasury note fell to 2.642, while CBOE's measure of market volatility, the VIX decreased by 25.7% to 21.33.


Portfolio Statistics
Based on the total capital invested and the portfolio's current market value, DivGro has delivered a simple return of about 121% since inception. In comparison, DivGro's IRR (internal rate of return) is 14.9%. (IRR takes into account the timing and size of deposits since inception, so it is a better measure of portfolio performance).
I track the yield on cost (YoC) for individual stocks, as well as an average YoC for my portfolio. DivGro's average YoC increased from 4.16% last month to 4.17% this month.
Percentage payback relates dividend income to the amount of capital invested. DivGro's average percentage payback is 29.2%, up from last month's 28.8%.
Finally, DivGro's projected annual yield is at 7.05%, up from last month's value of 6.90%. I calculate projected annual yield by dividing PADI ($44,900) by the total amount invested.
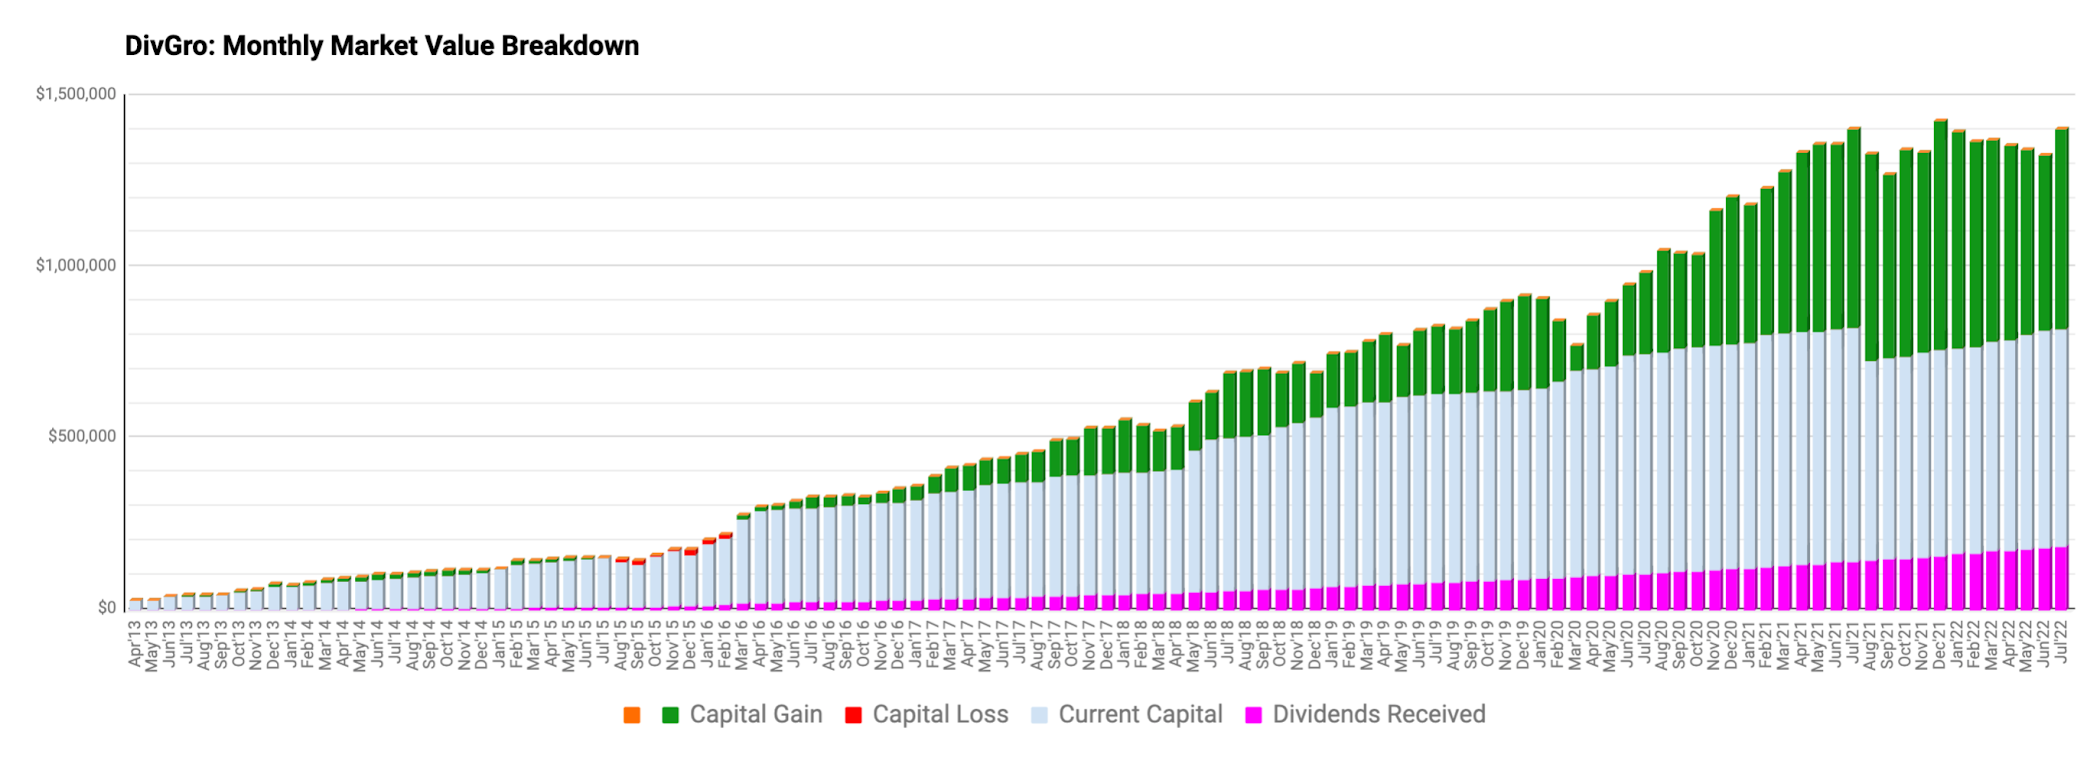
Here's a chart showing DivGro's market value breakdown. Dividends are plotted at the base of the chart so we can see them grow over time:
Looking Ahead
I'm happy with DivGro's performance in these tough market conditions!
We'll be on vacation for the next three weeks, traveling to South Africa to visit our parents and siblings. I'm not sure how much time I'll get to write articles, but we'll see how it goes!
Please see my Performance page for various visuals summarizing DivGro's performance.
You can now follow me on Twitter and Facebook.
Hi, very cool your trajectory, I just discovered your blog and I loved it.
ReplyDeleteCongratulations on the work of keeping so many charts up to date for so many years, and even more so with 100 stocks.
Hugs
Thanks for commenting! Fortunately, the site grew as my portfolio grew, so while it may seem like a lot, I now have a system in place that pretty much is rinse and repeat.
DeleteAll the best with your investments!
What's the thought process you utilize to decide when to sell a DGI stock?
ReplyDeleteGenerally, I don't like selling stocks. I have few positions that are "underwater" even after the recent stock market decline. Selling often means paying capital gains taxes, as many of my holdings are in a taxable account. Sometimes, though, despite my best efforts, a stock experiences a dividend cut or suspension, and I rarely hold onto such stocks ($ROST $DIS etc). A dividend freeze is a different matter, but I still review the reason for the freeze to make sure I still believe in the future of the company ($INTC $CVS which I still own after freezes). Then, if a company undergoes a major restructuring (spinoff, merger, acquisition), I may decide to close my position. I sometimes sell shares for tax-loss harvesting reasons, but that happens infrequently.
DeleteThank you. I see that you hold MMM for instance despite all the legal battle it's in. I'm also holding it. I wonder, at what point is still worth holding to these companies with not a great perspective in the foreseeable future.
DeleteOthers like MO and T are also a dilema to me at the moment. Thoughts?
$MMM is down significantly. I'm holding for now but will be reviewing my position in the next few months. Large corporations have "mechanisms" (and muscle) for dealing with litigation. JNJ's maneuvering comes to mind. As for $MO and $T, it depends on your goals. I've retained $MO so far, but rid my portfolio of $T (just-in-time as it turns out, as I sold at $28 per share). $MO's dividend is still growing, so I'm OK with staying put for now.
Delete