 This is the seventh annual review of DivGro, my portfolio of dividend growth stocks. I created DivGro in January 2013 to generate a reliable and growing dividend income stream.
In annual reviews, I look at DivGro's performance as measured by dividend income, dividend increases, annualized returns, and rate of return. I also look at some highlights of the past year and share my outlook for the coming year.
Keeping track of DivGro in a public forum helps me to learn and grow as a dividend growth [DG] investor. Much of my learning comes from the research I do while writing articles, but I've also learned a lot from interacting with like-minded investors. Thank you kindly for your comments, questions, support, and encouragement!
Introduction
The S&P 500 took quite a beating in December 2018 but recovered nicely with a 17.4% gain through May 2019. May was a down month but the markets rallied again in June and July to make new highs. After some meandering in August and September, another 12.2% rally ensued.
For the year, the S&P 500 returned about 29% (excluding dividends). This is a tremendous performance and certainly one to be savored! It is unlikely that we'll see returns like these again in 2020.

In 2019, I continued to reduce DivGro's risk profile by trimming or closing riskier positions and adding high-quality stocks with strong dividend safety ratings. With projected annual dividend income of more than $26,000, my portfolio has evolved into a proverbial dividend-generating machine.
Let's take a look at DivGro's performance in 2019.
Performance
Dividend Income
The main goal of DivGro is to generate a reliable and growing dividend income stream.
In 2019, DivGro generated dividends totaling $25,542, an increase of 26% over the 2018 total of $20,320.

Projected annual dividend income (PADI) increased by 14% to $26,358, meaning I can expect to earn monthly dividend income averaging at least $2,197 in perpetuity. (PADI one year ago was $23,039).

Of course, DivGro's PADI should increase over time because I invest in dividend growth stocks and I reinvest all dividends. I'm hoping to increase PADI to $30,000 in 2019, which, if realized, would be an increase of 38%.
Dividend Increases
In DG investing, regular dividend increases are just as important as dividend income. I use selection criteria that favor stocks with a track record of paying higher dividends every year. In 2019, the following DivGro stocks paid or announced higher dividends:
1-Year
Increase |
Company
|
Ticker
|
%Increase
|
Annual
Dividend | New YoC |
Outsized
(above 20%) |
Home Depot
Broadcom
Union Pacific
Mastercard
UnitedHealth
Visa
| HD AVGO UNP MA UNH V |
32.04%
22.64%
21.25%✧
21.21%
20.00%
20.00%
| $5.44 $13.00 $3.88 $1.60 $4.32 $1.20 | 2.99% 5.19% 2.62% 0.60% 2.49% 0.84% |
Large
(above 10% and up to 20%) |
TJX
Texas Instruments
Automatic Data Processing
Cummins
Lowe's
Starbucks
Snap-On
Ross Stores
Wells Fargo
NextEra Energy
JPMorgan Chase
Valero Energy
Nike
Merck
Microsoft
Hormel Foods
Stryker
Comcast
Gilead Sciences
Amgen
AbbVie
| TJX TXN ADP CMI LOW SBUX SNA ROST WFC NEE JPM VLO NKE MRK MSFT HRL SYK CMCSA GILD AMGN ABBV |
17.95%
16.88%
15.19%
15.00%
14.58%
13.89%
13.68%
13.33%
13.33%
12.61%
12.50%
12.50%
11.36%
10.91%
10.87%
10.71%
10.58%
10.53%
10.53%
10.34%
10.28%
| $0.92 $3.60 $3.64 $5.24 $2.20 $1.64 $4.32 $1.02 $2.04 $5.00 $3.60 $3.60 $0.98 $2.44 $2.04 $0.93 $2.30 $0.84 $2.52 $6.40 $4.72 | 2.08% 3.90% 2.28% 4.43% 2.38% 2.75% 2.88% 1.18% 4.09% 3.07% 3.44% 5.67% 1.20% 2.92% 4.37% 2.68% 1.10% 2.54% 3.57% 3.44% 7.66% |
Medium
(above 5% and up to 10%) |
Dominion Energy
Honeywell International
General Dynamics
Accenture
Lockheed Martin
Raytheon
T Rowe Price
Medtronic
McDonald's
Illinois Tool Works
Digital Realty Trust
Xcel Energy
Travelers
Chevron
Exxon Mobil
Cisco Systems
Eversource Energy
3M
Johnson & Johnson
Pfizer
United Parcel Service
Apple
Air Products and Chemicals
Blackrock
Bank of Nova Scotia
Main Street Capital
Intel
Simon Property
Altria
| D HON GD ACN LMT RTN TROW MDT MCD ITW DLR XEL TRV CVX XOM CSCO ES MMM JNJ PFE UPS AAPL APD BLK BNS MAIN INTC SPG MO |
9.88%
9.76%
9.68%
9.59%
9.09%
8.65%
8.57%
8.00%
7.76%
7.00%
6.93%
6.58%
6.49%
6.25%
6.10%
6.06%
5.94%
5.88%
5.56%
5.56%
5.49%
5.48%
5.45%
5.43%
5.34%
5.13%✧
5.00%
5.00%✧
5.00%
| $3.67 $3.60 $4.08 $3.20 $9.60 $3.77 $3.04 $2.16 $5.00 $4.28 $4.32 $1.62 $3.28 $4.76 $3.48 $1.40 $2.14 $5.76 $3.80 $1.52 $3.84 $3.08 $4.64 $13.20 $2.75 $2.46 $1.26 $8.40 $3.36 | 5.03% 2.47% 4.36% 1.82% 5.31% 2.60% 3.55% 2.37% 5.32% 3.15% 3.88% 4.73% 2.83% 4.16% 4.76% 3.33% closed 3.21% 3.49% 4.10% 3.36% 2.95% 2.94% 3.34% 5.05% 10.71% 5.55% 5.03% 6.74% |
Small
(above 2.5% and up to 5%) |
Stanley Black & Decker
EPR Properties
Toronto-Dominion Bank
Procter & Gamble
Iron Mountain
Walgreens Boots Alliance
Aflac
International Business Machines
Royal Bank of Canada
National Retail Properties
PepsiCo
Realty Income
Chubb
Philip Morris International
Coca-Cola
| SWK EPR TD PG IRM WBA AFL IBM RY NNN PEP O CB PM KO |
4.55%
4.17%
4.08%
4.00%
4.00%
3.98%
3.85%
3.18%
3.16%
3.00%
2.96%
2.94%✧
2.74%
2.63%
2.56%
| $2.76 $4.50 $2.25 $2.98 $2.44 $1.83 $1.08 $6.48 $3.16 $2.06 $3.82 $2.73 $3.00 $4.68 $1.60 | 2.17% closed 3.98% 3.65% closed 2.96% 4.31% 4.56% 4.02% 5.21% 3.28% 5.76% 2.59% 5.83% 3.88% |
| Tiny (below 2.5%) |
Verizon Communications
AT&T
Tanger Factory Outlet Centers
WP Carey
Taiwan Semiconductor Manufacturing
Canadian National Railway
| VZ T SKT WPC TSM CNI |
2.07%
1.96%
1.43%
1.27%✧
0.65%
0.35%
| $2.46 $2.08 $1.42 $4.15 $1.30 $1.63 | 5.23% 6.46% 7.10% 6.38% 3.06% 1.77% |
✧multiple increases
The table includes the new yield on cost (YoC) for positions still in my portfolio.
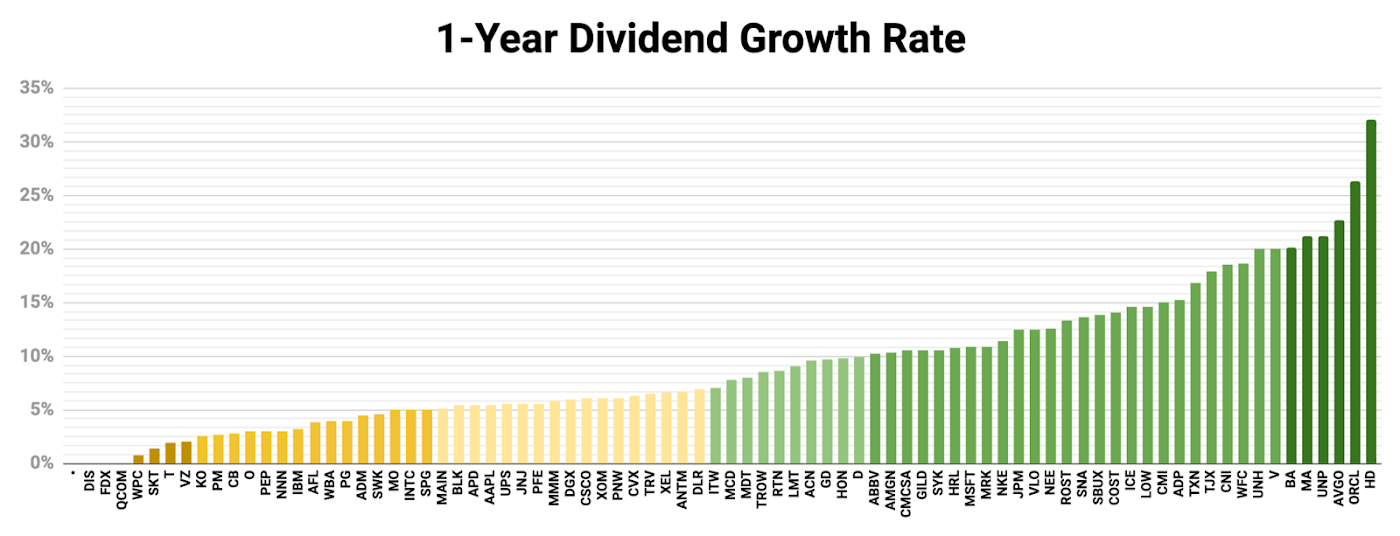
The arithmetic average of the 77 increases above is 8.58%, down from last year's 10.68% from 43 increases. Note that I've closed three of these positions.
I like to see dividend increases of 7% or higher. In the following chart, DG stocks in my DivGro portfolio with year over year increases of at least 7% are shown in shades of green. I'm happy to see that more than half of the DG stocks in my portfolio have year over increases of at least 7%!
Annualized Returns
In 2019, the S&P 500 gained 28.9%, the Dow gained 22.3%, and the Nasdaq gained 35.2%. This makes 2019 the best annual performance since 2013 for the S&P 500 and Nasdaq, and the best annual performance for the Dow since 2017.
DivGro also performed well in 2019, with most of my existing positions showing positive gains for the year. Of the 54 DG stocks I owned throughout the year, only four did not trade higher at year's end. On average, the 54 positions gained 23.4% in 2019 (excluding dividends).

Note that I also own dividend-paying stocks and a fund that pays dividends, as well as a few stocks that do not pay dividends.
Here is a chart showing the annualized returns of all positions in my portfolio (including dividends where applicable):

Microsoft (MSFT) (+63%), Nike (NKE) (+52%), Apple (AAPL) (+51%), Qualcomm (QCOM) (+51%), and Air Products and Chemicals (APD) (+45%), are DivGro's top-performing stocks based on annualized returns. MSFT and AAPL are Home Run stocks, a designation I give to stocks in my portfolio that achieve total returns of 100%. Note that I have not yet owned NKE and QCOM for a year.
Rate of Return
DivGro's IRR (internal rate of return) provides the best measure of overall portfolio performance, as IRR takes into account the timing and size of deposits since inception. On 31 December 2019, DivGro's IRR was 15.5%, up from the 12.7% reported in 2018.
Rate of Return
DivGro's IRR (internal rate of return) provides the best measure of overall portfolio performance, as IRR takes into account the timing and size of deposits since inception. On 31 December 2019, DivGro's IRR was 15.5%, up from the 12.7% reported in 2018.
Other Statistics
At the end of 2019, DivGro's average YoC was 3.7%, down slightly from 2018's average YoC of 3.8%. Over time, as stocks I own pay higher dividends, DivGro's average YoC should increase.

DivGro's payback increased from 11.3% at the end of 2017 to 13.1% at the end of 2018. Payback is the proportion of capital returned as dividends. I consider it to be a reasonable measure of portfolio maturity.

Main Street Capital (MAIN) tops the chart, mainly because the company pays a generous dividend and it is the stock I've owned the longest.
2019 Highlights
The 2019 stock market will be remembered for its stellar performance! DivGro's market value crossed $900,000 in 2019 and my dividend income topped $25,500. I'm happy to report that DivGro's options income topped $30,000, so this is the second consecutive year that options income exceeded dividend income! The extra income generated by trading options allows me to buy more dividend growth stocks, so boosting DivGro's dividend-generating capability.
In my annual reviews, I also like to share some personal highlights.
Last year, Pixar's Toy Story 4 grossed $1.073 billion at the box office and the film just won the Critics' Choice Award for Best Animated Film! We've already completed Pixar's next feature, Onward, which will be released on 6 March 2020. And we're working hard on our next film, Soul.
In the summer of 2019, our two youngest sons got married and we were happy that their grandparents could attend both weddings, all the way from South Africa!
Pageviews
DivGro's pageviews stood at 1.34 million on 4 January 2019. Since then, I've added nearly 430,000 pageviews at an average of 1,181 pageviews per day or 35,833 pageviews per month. In 2018, I averaged 27,022 pageviews per month.
 |
4 January 2019
average since inception:
611 pageviews |  |
3 January 2020
average since inception:
692 pageviews |
Popular Posts
In 2019, I published 144 articles, which included 89 premium articles published at Seeking Alpha. Here are some of the most successful articles in 2019, based on pageviews:
Top 2019 DivGro Article:
• 04 Jul'19: The Dividend Kings Ranked By Quality Score (2,288 pageviews)
Top 2019 Seeking Alpha Article (and All-Time Most Popular Article):
• 30 Jun'19: The Dividend Aristocrats Ranked By Quality Score (31,490 pageviews)
2020 Outlook
I've set some challenging goals for 2019, including collecting dividend and options income totaling $51,000. Along with new capital of $24,000 and some "passive" income of $5,000, I'm hoping to put $80,000 to work in DivGro in 2020.
In 2019, I worked hard at improving the risk profile of my portfolio. Most of the stocks in my portfolio have Very Safe dividend safety scores and my largest position is only 3.23% of total portfolio value.
In 2020, I want to focus on improving DivGro's growth prospects by investing in higher dividend growth rate stocks. Doing so will be challenging, as high dividend growth rate stocks often trade at prremium valuations.
A special word of thanks to all my readers, especially to those that comment regularly and continue to encourage me! This community is amazing and I really love being part of it!
Thanks for reading and all the best with your investing in 2020!
No comments :
Post a Comment
Please don't include links in comments. I will mark such comments as spam and the comment won't be published. To make me aware of your blog or website, comment on my Blogrole page instead.