
Welcome to the monthly review of DivGro, my portfolio of dividend growth stocks.
Every month, I present details of any buys or sells, and I provide a summary of dividends collected. Additionally, I look at how the month's activities have impacted DivGro's projected annual dividend income (PADI).
In April, I executed no buy or sell transactions, choosing instead to build cash reserves.
Eight DivGro stocks announced dividend increases in April and pushed PADI up by about 0.4%. Year over year, PADI increased by 25.9%.
As for dividend income, in April I received dividends totaling $2,669 from 30 stocks in my portfolio, a year over year increase of 15%. So far in 2022, I've collected $16,156 in dividends, or about 37% of my 2022 goal of $43,200.
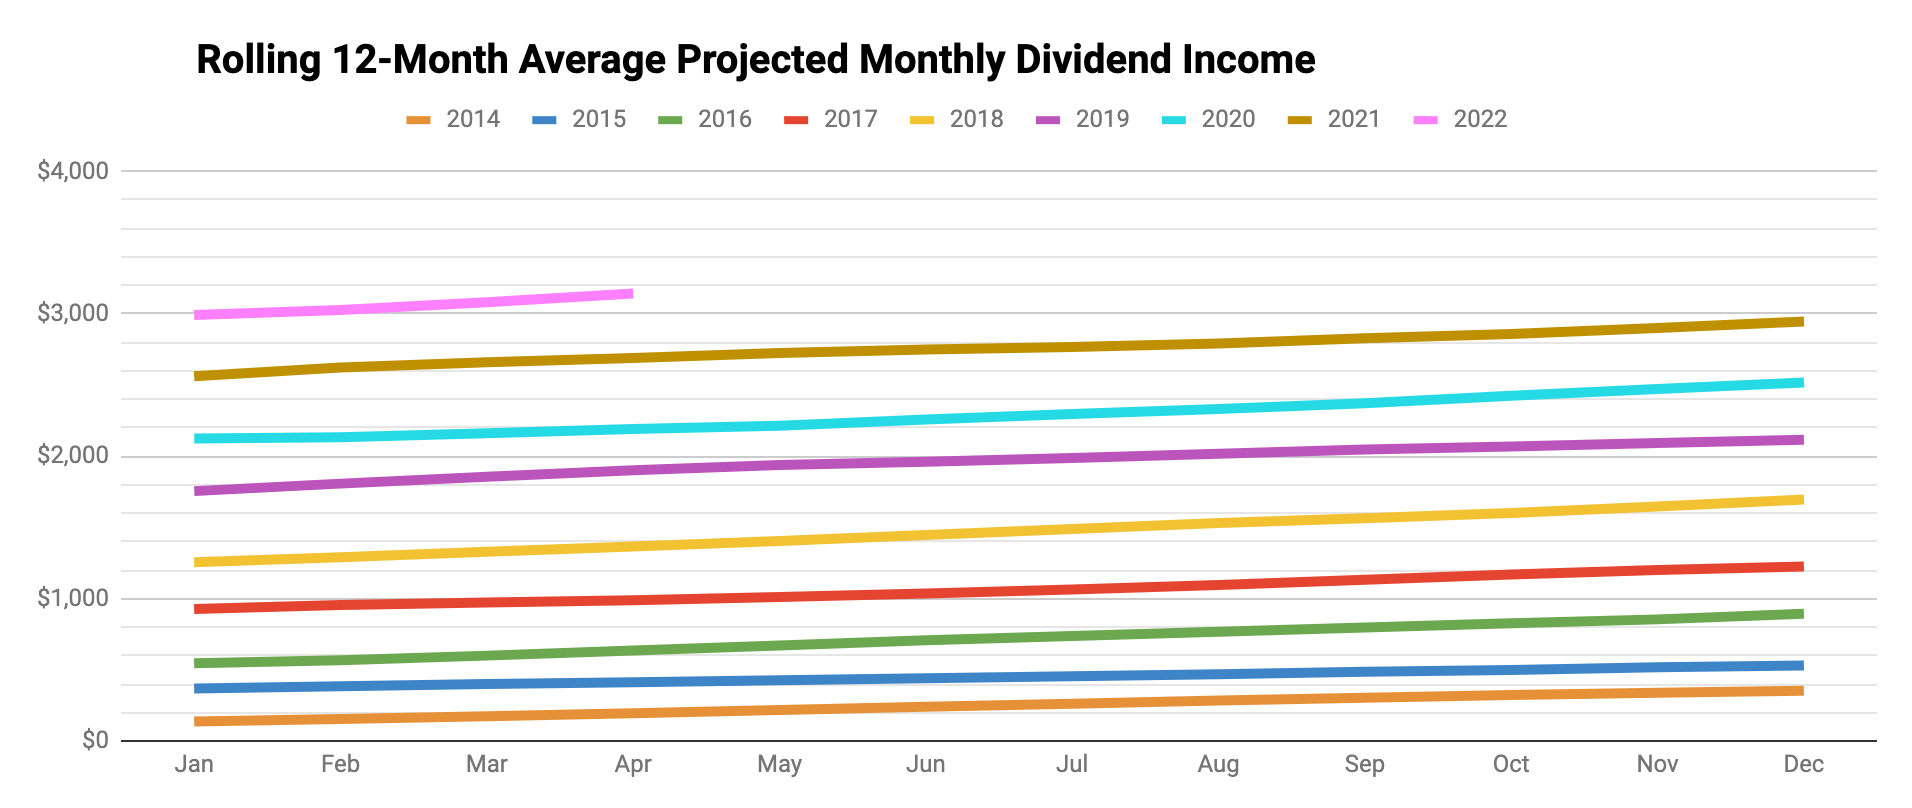
DivGro's PADI now stands at $42,698, which means I can expect to receive $3,558 in dividend income per month, on average, in perpetuity, assuming the status quo is maintained. Of course, I expect the companies I've invested in not only to continue paying dividends but to increase them over time! Also, until I retire, I hope to continue reinvesting dividends, so DivGro's PADI should continue to grow through dividend growth and through compounding.
Dividend Income
I received dividends from 30 different stocks, for a monthly total of $2,669 in dividend income:
Here is a list of the dividends I collected in April:
- Automatic Data Processing, Inc (ADP) — income of $104.00
- Virtus AllianzGI Artificial Intelligence & Technology Opportunities Fund (AIO) — income of $98.40
- The Allstate Corporation (ALL) — income of $85.00
- American Tower Corporation (AMT) — income of $14.00
- Franklin Resources, Inc (BEN) — income of $87.00
- The Bank of Nova Scotia (BNS) — income of $116.77
- BlackRock Science and Technology Trust (BST) — income of $100.00
- Chubb Limited (CB) — income of $80.00
- Comcast Corporation (CMCSA) — income of $81.00
- Canadian National Railway Company (CNI) — income of $73.30
- Cisco Systems, Inc (CSCO) — income of $91.20
- DTE Energy Company (DTE) — income of $88.50
- Eaton Vance Tax-Advantaged Global Dividend Opportunities Fund (ETO) — income of $224.00
- Eaton Vance Tax-Advantaged Dividend Income Fund (EVT) — income of $203.25
- FedEx Corporation (FDX) — income of $37.50
- Illinois Tool Works Inc (ITW) — income of $73.20
- The Coca-Cola Company (KO) — income of $88.00
- Main Street Capital (MAIN) — income of $55.90
- Mondelez International, Inc. (MDLZ) — income of $70.00
- Medtronic plc (MDT) — income of $63.00
- Altria Group, Inc (MO) — income of $207.00
- Merck & Co., Inc (MRK) — income of $138.00
- NIKE, Inc (NKE) — income of $4.58
- Realty Income Corporation (O) — income of $37.05
- Oracle Corporation (ORCL) — income of $48.00
- Philip Morris International Inc (PM) — income of $150.00
- Sempra Energy (SRE) — income of $57.25
- Stryker Corporation (SYK) — income of $6.95
- W. P. Carey Inc (WPC) — income of $105.70
- Xcel Energy Inc (XEL) — income of $80.44
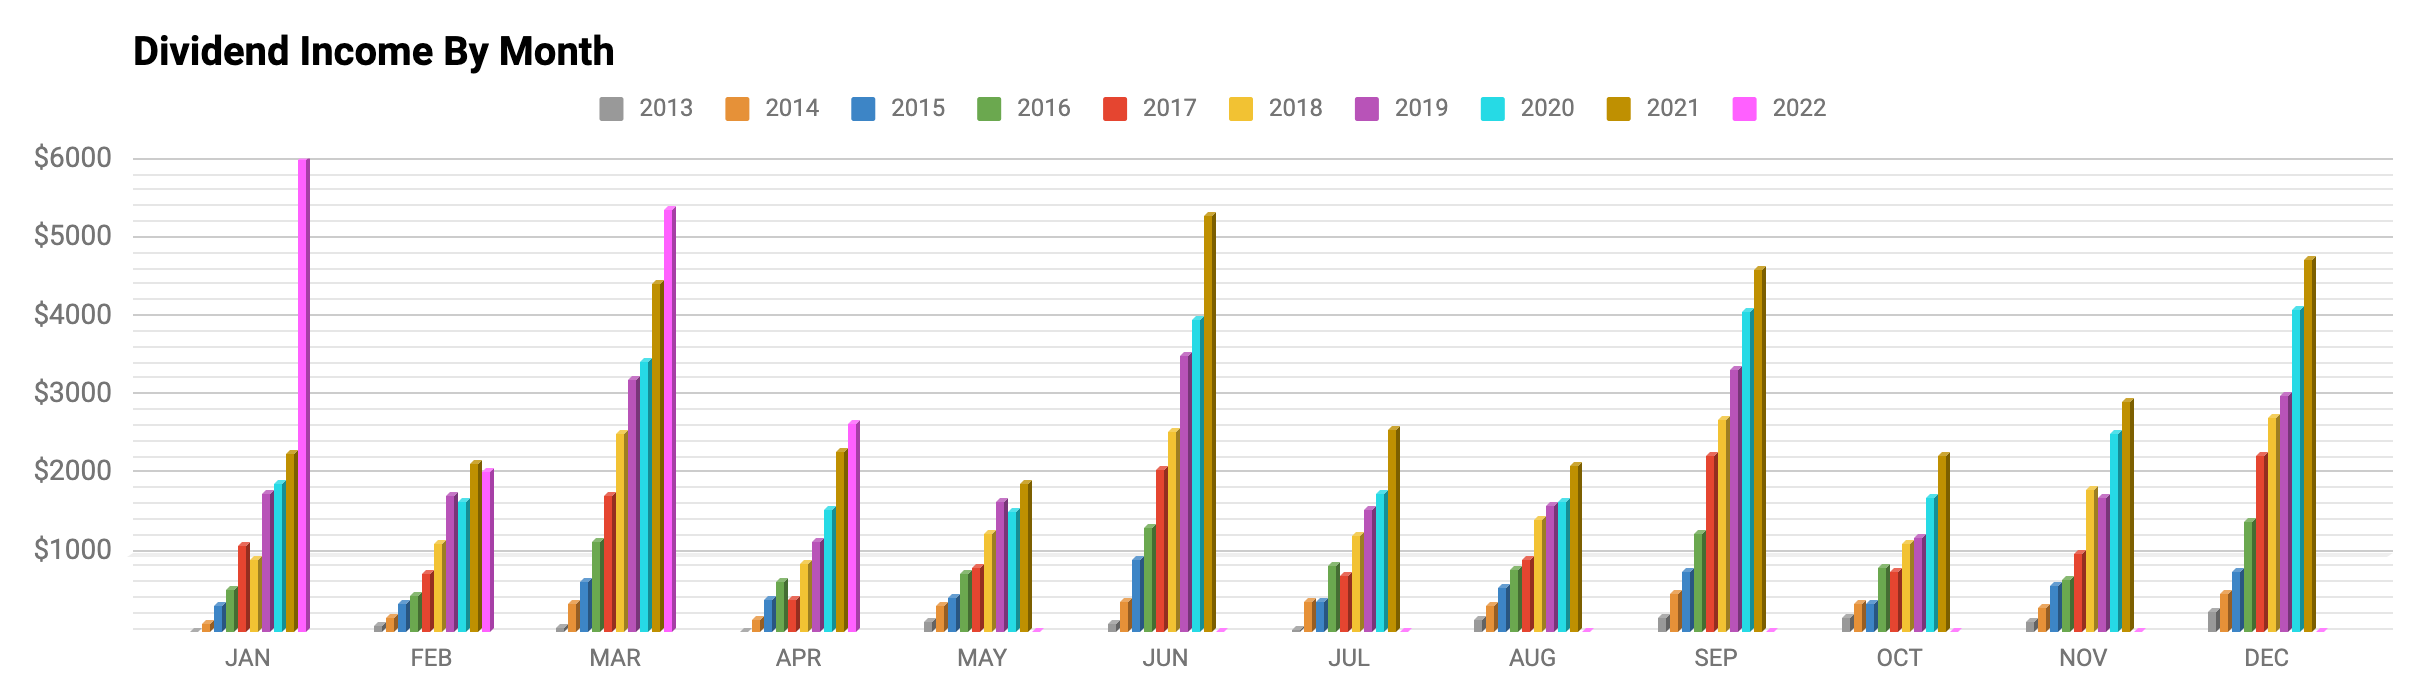
The following chart shows DivGro's monthly dividends plotted against PMDI. Quarter-ending months are huge outliers:

This is one reason that I now create a rolling 12-month average of dividends received (the orange bars) plotted against a rolling 12-month average of PMDI (the blue, staggered line):
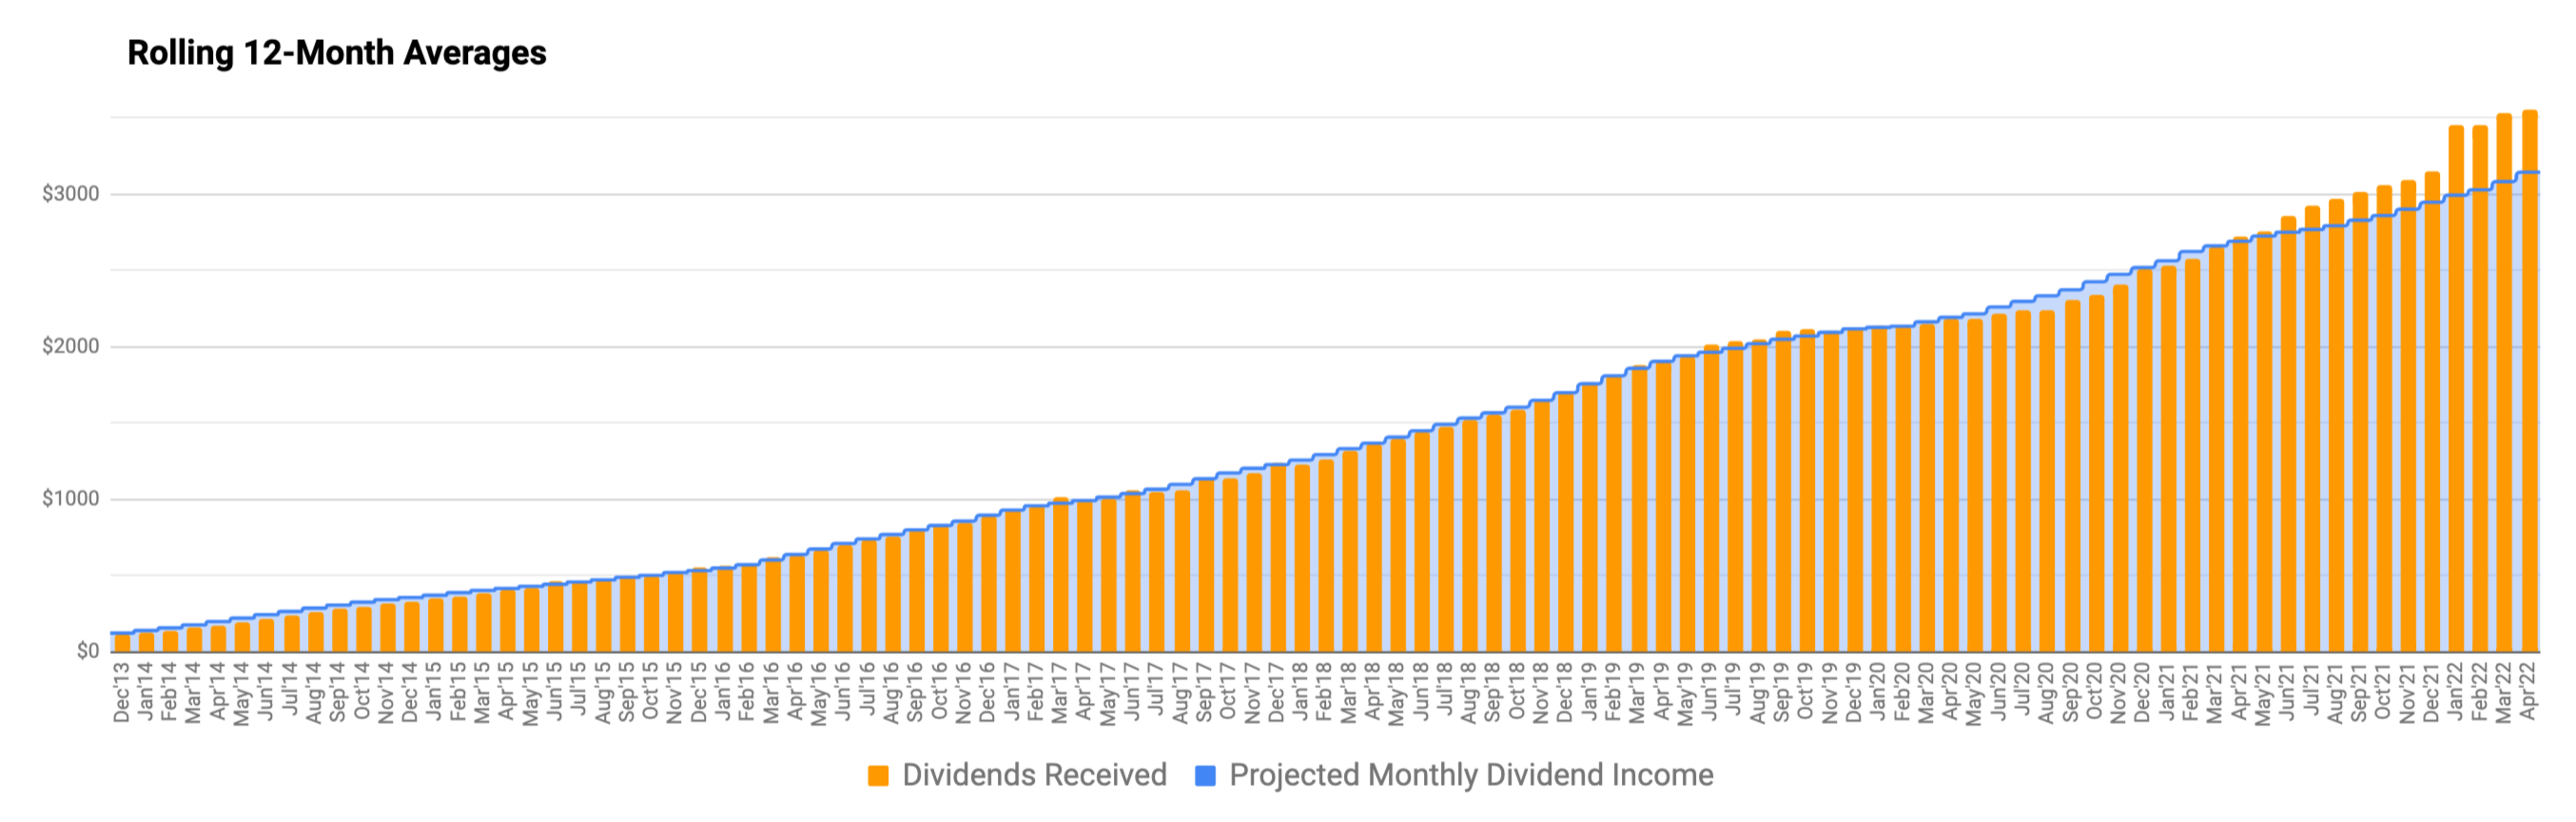
While it would be nicer if dividends were distributed more evenly, it is not something that would drive my investment decisions.
Dividend Changes
In April, the following stocks announced dividend increases:
- Apple Inc (AAPL) — increase of 4.55%
- Canadian National Railway Company (CNI) — increase of 21.93%
- Costco Wholesale Corporation (COST) — increase of 13.92%
- International Business Machines Corporation (IBM) — increase of 0.61%
- Johnson & Johnson (JNJ) — increase of 6.60%
- The Procter & Gamble Company (PG) — increase of 5.00%
- Raytheon Technologies Corporation (RTX) — increase of 7.84%
- The Travelers Companies, Inc (TRV) — increase of 5.68%
As a result of these changes, DivGro's PADI will increase by $153.
I like seeing dividend increases above 7%, and only three of the eight increases top my expectations. However, the arithmetic average of this month's dividend increases is 8.27%, which tops my 7% threshold and easily beats inflation.
Transactions
I had no buys or sells in April.
I'm continuing to slowly rebalance DivGro between Defensive, Sensitive, and Cyclical supersectors. Below is a chart showing the current distribution with an insert of last month's distribution.

My exposure to the Defensive sectors increased (+1.1%) at the cost of the Cyclical sectors (-0.8%) and the Sensitive sectors (-0.3%).
I want to further decrease DivGro's exposure to the Sensitive sectors and increase exposure to the Cyclical sectors. An equal distribution between the Cyclical, Defensive, and Sensitive sectors would be ideal.
In November 2021, I reworked my system for determining target weights for DivGro. The system is dynamic and flexible and allows me to calibrate factors when my goals change. Following is a chart showing the current and target weights of dividend-paying stocks in DivGro:

Markets
Here is a summary of various market indicators, showing the changes over the last month:
|
DOW 30 |
S&P 500 |
NASDAQ Composite |
10-YR BOND |
CBOE VIX |
|
| Mar 31, 2022 | 34,678.35 | 4,530.41 | 14,220.52 | 2.327 | 20.56 |
| Apr 30, 2022 | 32,977.21 | 4,131.93 | 12,334.64 | 2.887 | 33.40 |
In April, the DOW 30 dropped 4.9%, the S&P 500 dropped 8.8%, and the NASDAQ dropped 13.3%. April certainly was challenging! The yield on the benchmark 10-year Treasury note rose to 2.887%, while CBOE's measure of market volatility, the VIX, increased by 62.5% to 33.4.


Portfolio Statistics
Based on the total capital invested and the portfolio's current market value, DivGro has delivered a simple return of about 121% since inception. In comparison, DivGro's IRR (internal rate of return) is 15.3%. (IRR takes into account the timing and size of deposits since inception, so it is a better measure of portfolio performance).
I track the yield on cost (YoC) for individual stocks, as well as an average YoC for my portfolio. DivGro's average YoC increased from 4.17% last month to 4.18% this month.
Percentage payback relates dividend income to the amount of capital invested. DivGro's average percentage payback is 28.5%, up from last month's 28.1%.
Finally, DivGro's projected annual yield is at 6.96%, up from last month's value of 6.95%. I calculate projected annual yield by dividing PADI ($42,698) by the total amount invested.
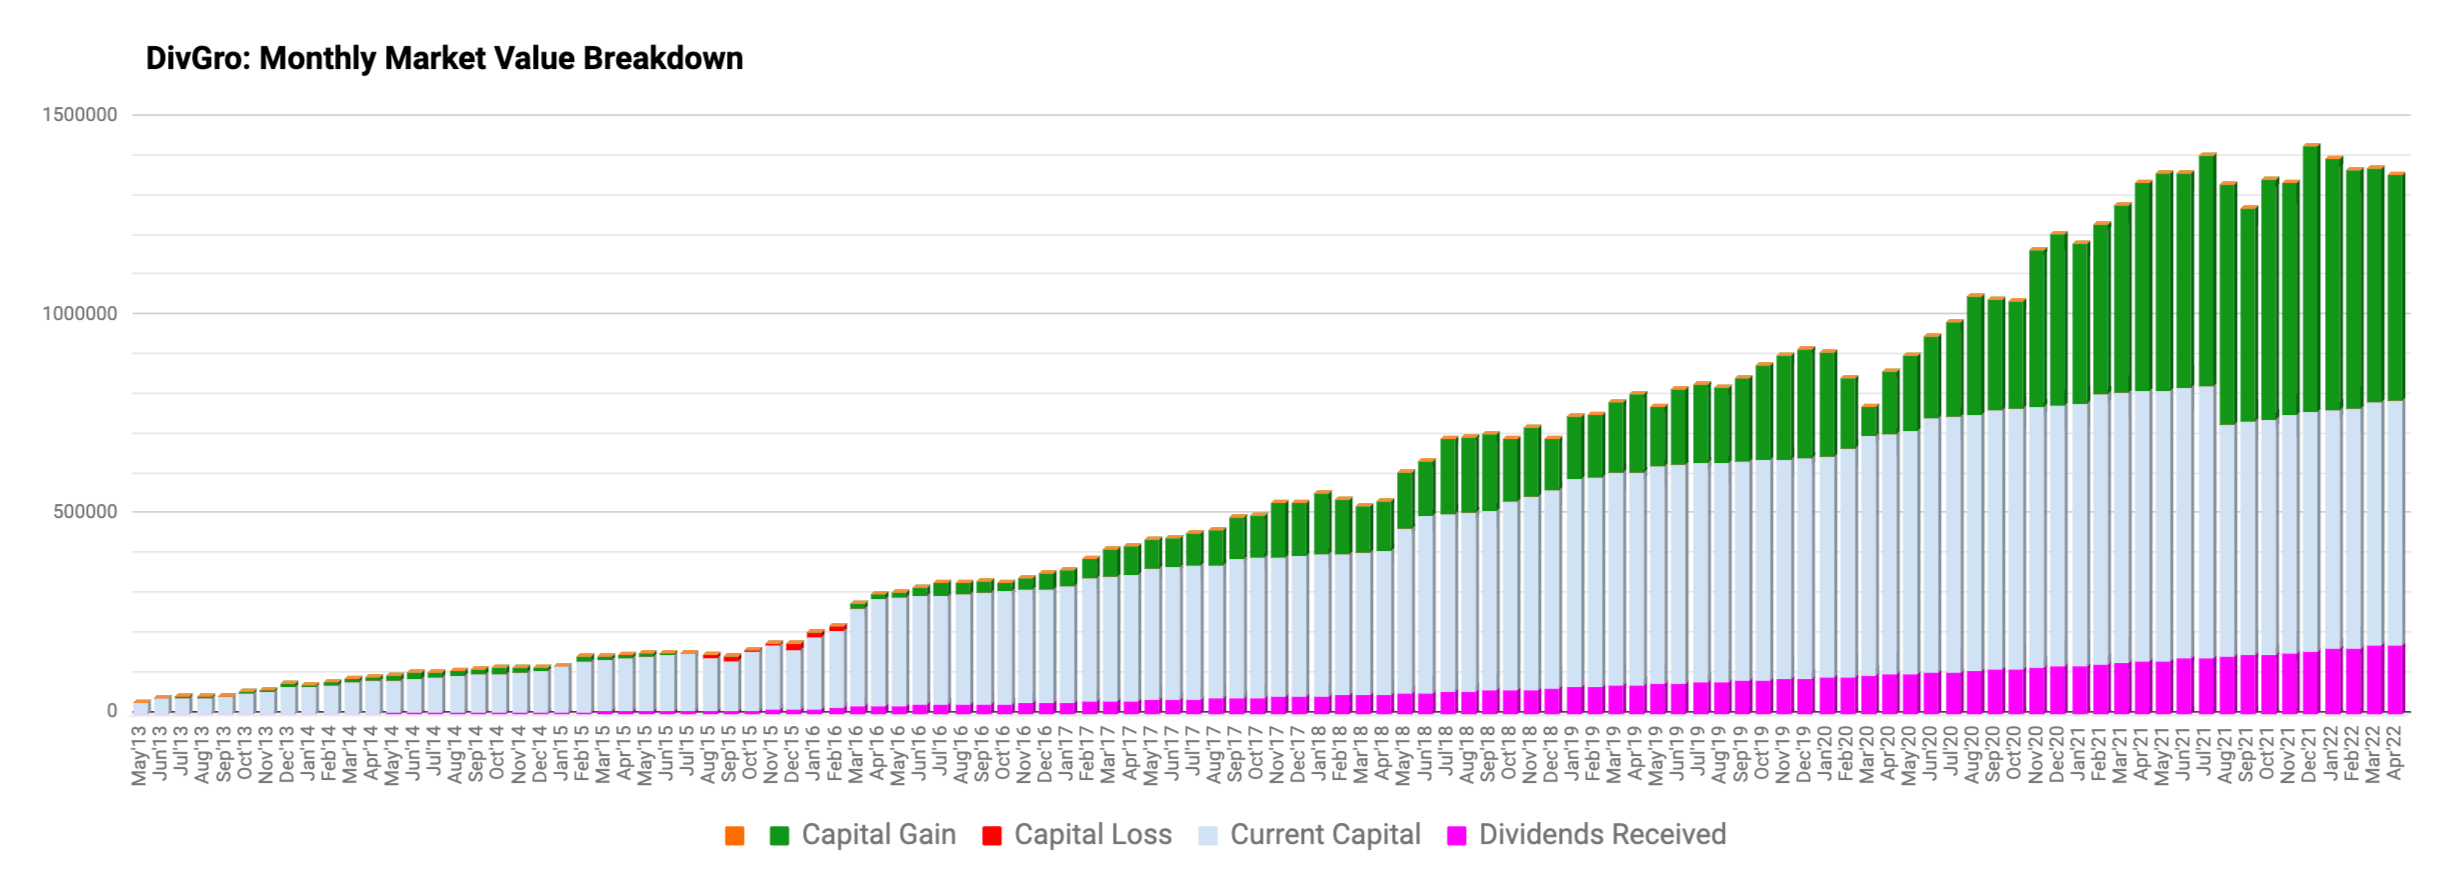
The following chart shows DivGro's market value breakdown. Dividends are plotted at the base of the chart so we can see them grow over time:
Looking Ahead
I'm happy that DivGro is outperforming the S&P 500 in these challenging times. I'm hoping to add shares to high-quality, undervalued positions that are underweight relative to my ideal portfolio target weights.
Please see my Performance page for various visuals summarizing DivGro's performance.
Thanks for reading and take care, everybody!
You can now follow me on Twitter and Facebook.
If you liked this article and would like to read similar articles in future, please click the "Follow" link at the top of this article.
Great job!
ReplyDeleteThanks!
Delete