 I'm behind on writing my monthly reviews of DivGro because a project I worked
on in the first three months of 2022 essentially consumed all available
time!
I'm behind on writing my monthly reviews of DivGro because a project I worked
on in the first three months of 2022 essentially consumed all available
time!
I'm hoping to catch up soon! Following this review, I still need to write a quarterly review for Q1-2022 and then my monthly review for April. Then I'll be all caught up!
DivGro is my portfolio of dividend growth stocks. The goal of monthly reviews is to provide a summary of dividends received and to detail buy and sell transactions. I also look at how DivGro's projected annual dividend income (PADI) has changed.
In March, I added shares to four existing positions. Eight DivGro stocks announced dividend increases in March. The net result of these changes is that PADI increased by about 5.8% in March. Year over year, PADI increased by 22.6%.
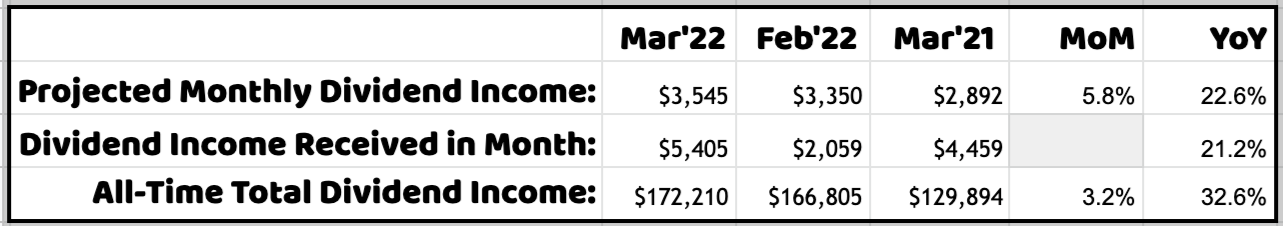
So far in 2022, I've collected $13,487 in dividends, or about 31% of my 2022 goal of $43,200.

Assuming the status quo and given DivGro's PADI of $42,546, I can expect to receive $3,545 in dividend income per month, on average, in perpetuity. Of course, most of the stocks I own are dividend growers, so I expect my dividend income to increase over time! Furthermore, I plan to reinvest dividends until I retire, so DivGro's PADI should continue to grow through dividend growth and through compounding.
Dividend Income
In March, I received a total of $5,405 in dividend income from 50 different stocks:
Here is a list of the dividends I received in March:
- Archer-Daniels-Midland Company (ADM) — income of $80.00
- Aflac Incorporated (AFL) — income of $80.00
- Virtus AllianzGI Artificial Intelligence & Technology Opportunities Fund (AIO) — income of $60.00
- Amgen Inc (AMGN) — income of $174.60
- Anthem, Inc (ANTM) — income of $12.80
- Atmos Energy Corporation (ATO) — income of $136.00
- Broadcom Inc (AVGO) — income of $123.00
- American States Water Company (AWR) — income of $31.03
- BlackRock, Inc (BLK) — income of $170.80
- BlackRock Science and Technology Trust (BST) — income of $100.00
- Cummins Inc (CMI) — income of $72.50
- Cintas Corporation (CTAS) — income of $9.50
- Chevron Corporation (CVX) — income of $213.00
- Digital Realty Trust, Inc (DLR) — income of $54.90
- Enbridge Inc (ENB) — income of $202.80
- Eaton Vance Tax-Advantaged Global Dividend Opportunities Fund (ETO) — income of $224.00
- Eaton Vance Tax-Advantaged Dividend Income Fund (EVT) — income of $203.25
- Gilead Sciences, Inc (GILD) — income of $146.00
- The Home Depot, Inc (HD) — income of $133.00
- Honeywell International Inc (HON) — income of $68.60
- International Business Machines Corporation (IBM) — income of $164.00
- Intercontinental Exchange, Inc (ICE) — income of $38.00
- Intel Corporation (INTC) — income of $73.00
- Johnson & Johnson (JNJ) — income of $133.56
- Lockheed Martin Corporation (LMT) — income of $112.00
- Main Street Capital (MAIN) — income of $75.40
- McDonald's Corporation (MCD) — income of $69.00
- 3M Company (MMM) — income of $111.75
- Microsoft Corporation (MSFT) — income of $62.00
- NextEra Energy, Inc (NEE) — income of $42.50
- Virtus AllianzGI Equity & Convertible Income Fund (NIE) — income of $625.00
- Northrop Grumman Corporation (NOC) — income of $62.80
- Realty Income Corporation (O) — income of $36.98
- Public Service Enterprise Group Incorporated (PEG) — income of $135.00
- PepsiCo, Inc (PEP) — income of $64.50
- Pfizer Inc (PFE) — income of $80.00
- Pinnacle West Capital Corporation (PNW) — income of $212.50
- Public Storage (PSA) — income of $120.00
- QUALCOMM Incorporated (QCOM) — income of $47.60
- Raytheon Technologies Corporation (RTX) — income of $51.00
- Snap-on Incorporated (SNA) — income of $85.20
- The TJX Companies, Inc (TJX) — income of $26.00
- T Rowe PriceT. Rowe Price Group, Inc (TROW) — income of $120.00
- The Travelers Companies, Inc (TRV) — income of $88.00
- Tyson Foods, Inc (TSN) — income of $69.00
- UnitedHealth Group Incorporated (UNH) — income of $87.00
- Union Pacific Corporation (UNP) — income of $56.64
- United Parcel Service, Inc (UPS) — income of $76.00
- Visa Inc (V) — income of $37.50
- Valero Energy Corporation (VLO) — income of $147.00
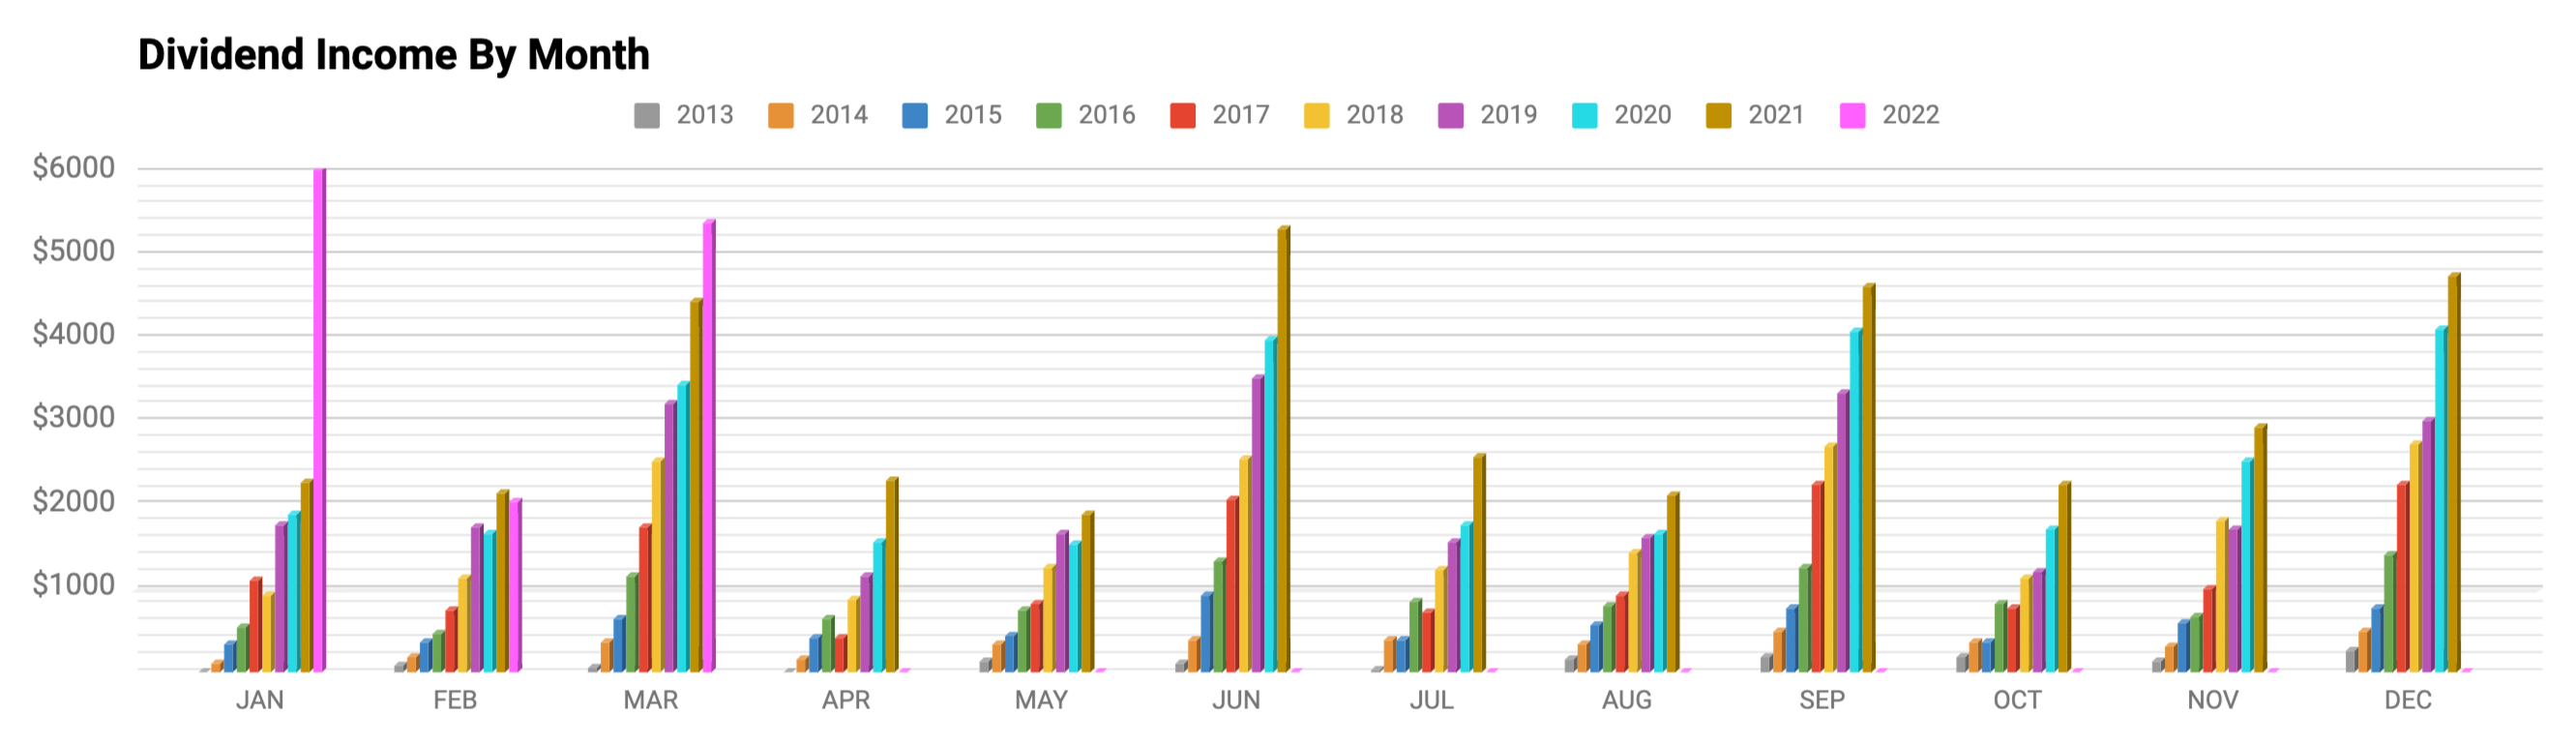
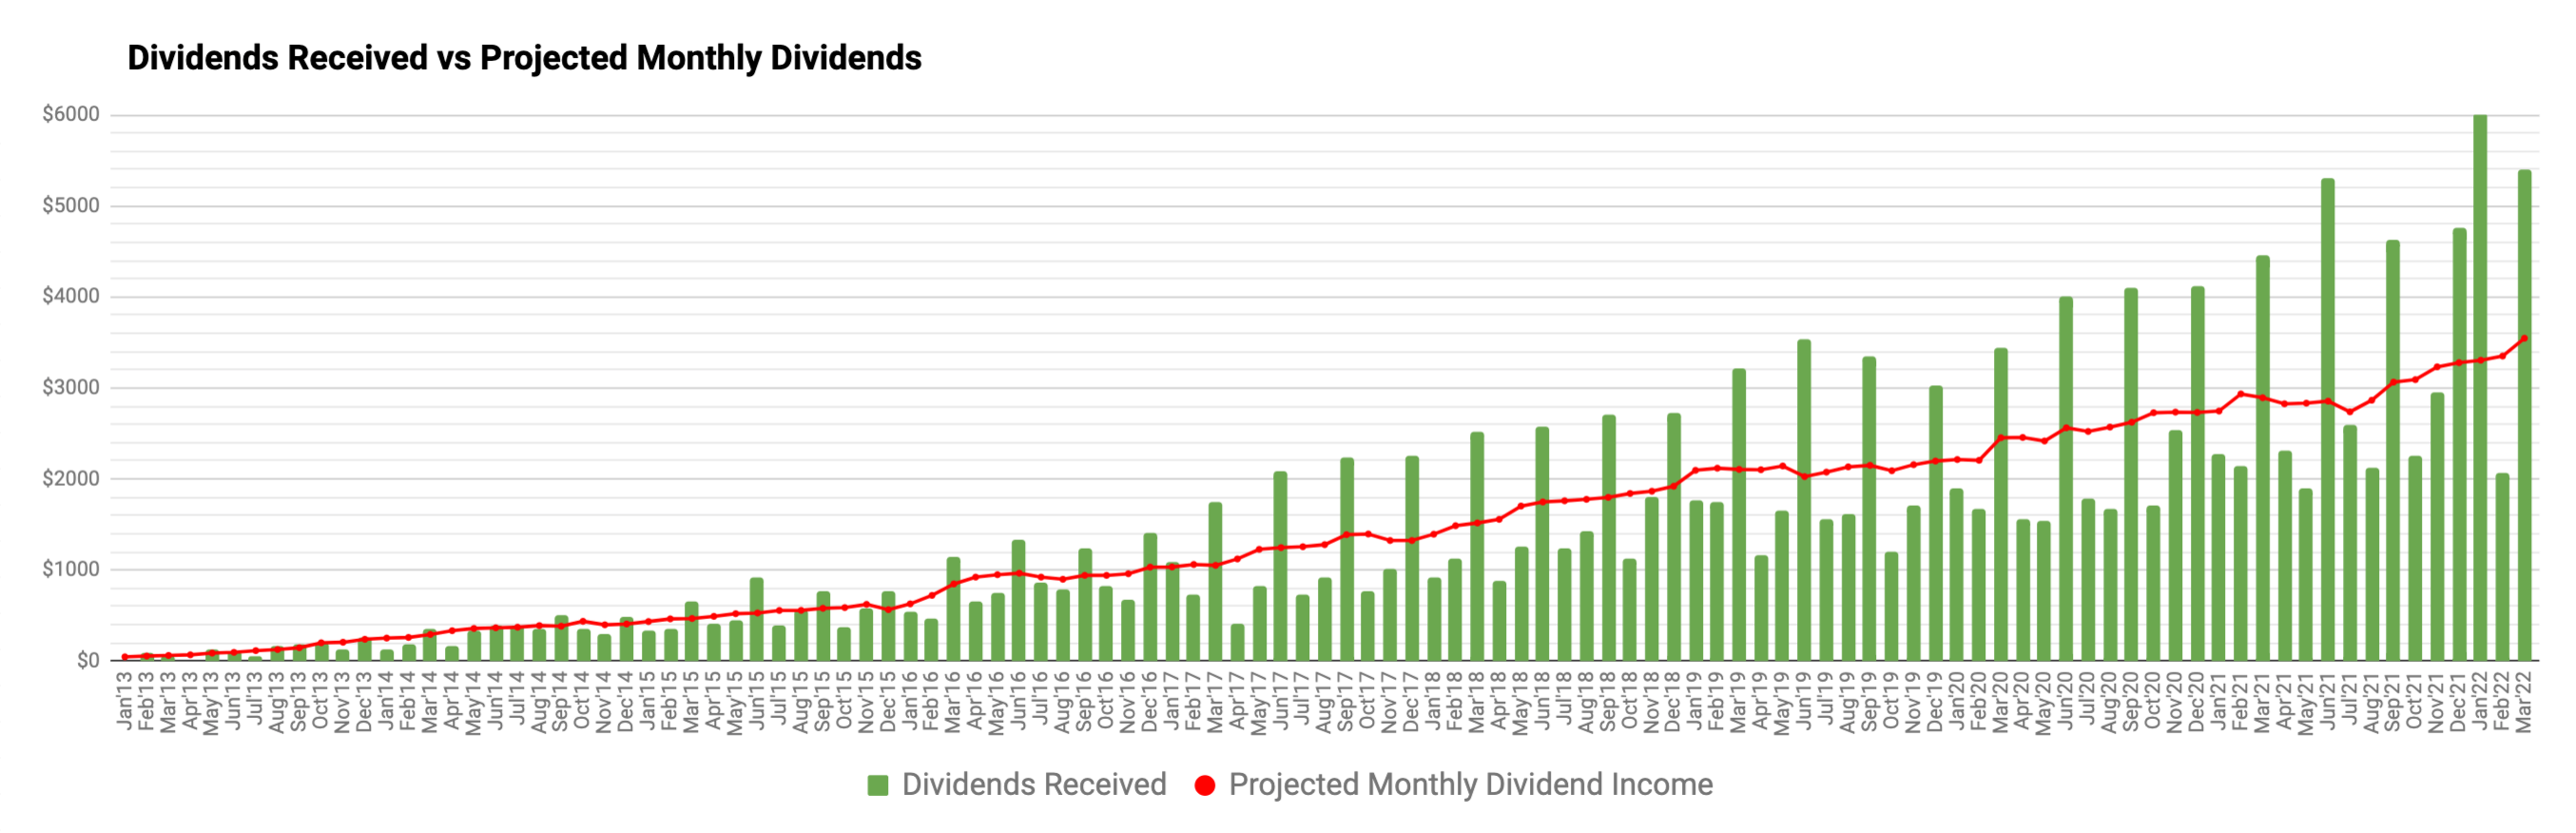
The following chart shows DivGro's monthly dividends plotted against PMDI. Quarter-ending months are huge outliers:
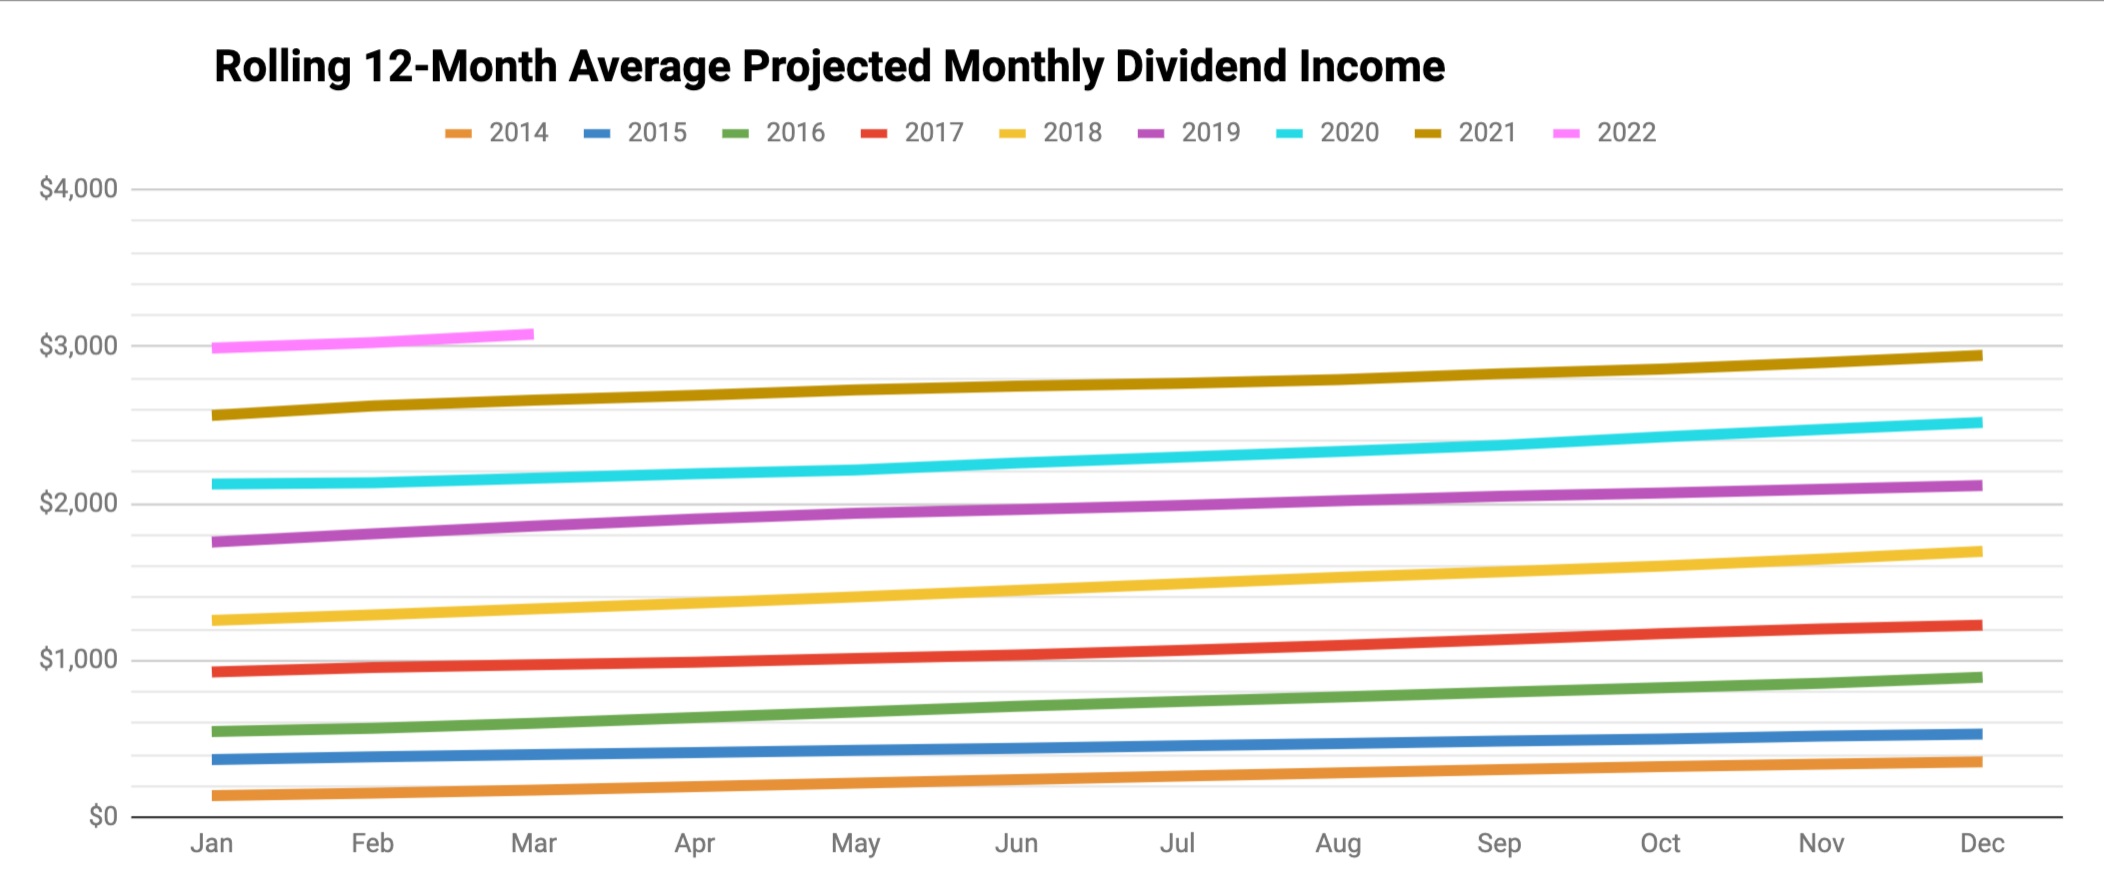
For this reason, I now create a rolling 12-month average of dividends received (the orange bars) plotted against a rolling 12-month average of PMDI (the blue, staggered line):
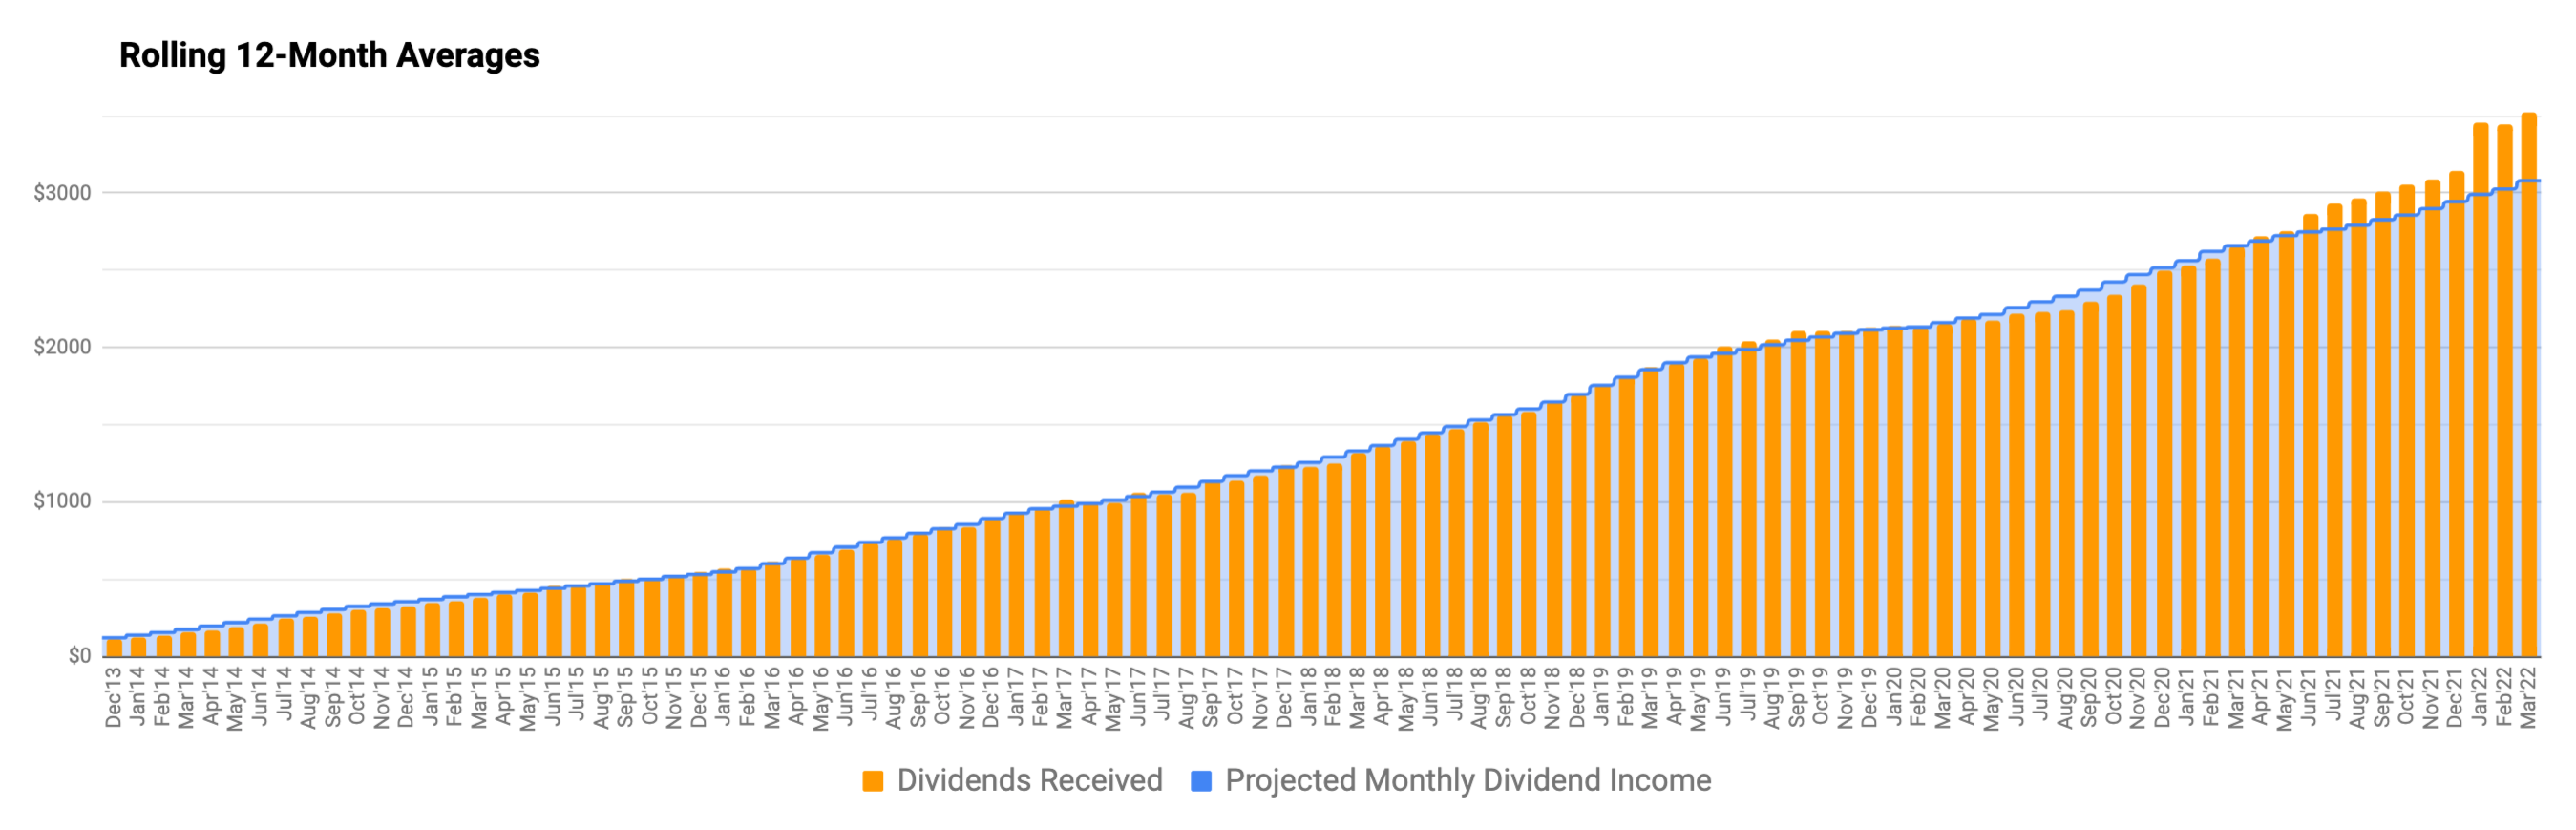
While I would prefer receiving more evenly distributed dividends, I wouldn't let that influence my investment decisions.
Dividend Changes
In March, the following stocks announced dividend increases:
- American Tower Corporation (AMT) — increase of 0.72%
- Digital Realty Trust, Inc (DLR) — increase of 5.17%
- Enbridge Inc (ENB) — increase of 3.86%
- General Dynamics Corporation (GD) — increase of 5.88%
- NextEra Energy, Inc (NEE) — increase of 10.39%
- Virtus AllianzGI Equity & Convertible Income Fund (NIE) — increase of 31.58%
- Realty Income Corporation (O) — increase of 0.20%
- W. P. Carey Inc (WPC) — increase of 0.19%
These changes will increase DivGro's PADI by $687.
I like seeing dividend increases above 7%. Only two of this month's eight increases top my expectations. However, the arithmetic average of this month's dividend increases is 7.25%, above my desired target and an average that still beats the rate of inflation.
Transactions
Here is a summary of my transactions in March:
- Virtus AllianzGI Artificial Intelligence & Technology Opportunities Fund (AIO) — added 400 shares and doubled my position to 800 shares
- BlackRock Science and Technology Trust (BST) — added 200 shares and doubled my position to 400 shares
- Amgen Inc (AMGN) — added 25 shares and increased position to 115 shares
- American States Water Company (AWR) — added 100 shares and increased position to 185 shares
These transactions increased DivGro's PADI by about $1,660.
In November 2021, I reworked my system for determining target weights for DivGro. The system is dynamic and flexible and allows me to calibrate factors when my goals change. Following is a chart showing the current and target weights of dividend-paying stocks in DivGro:
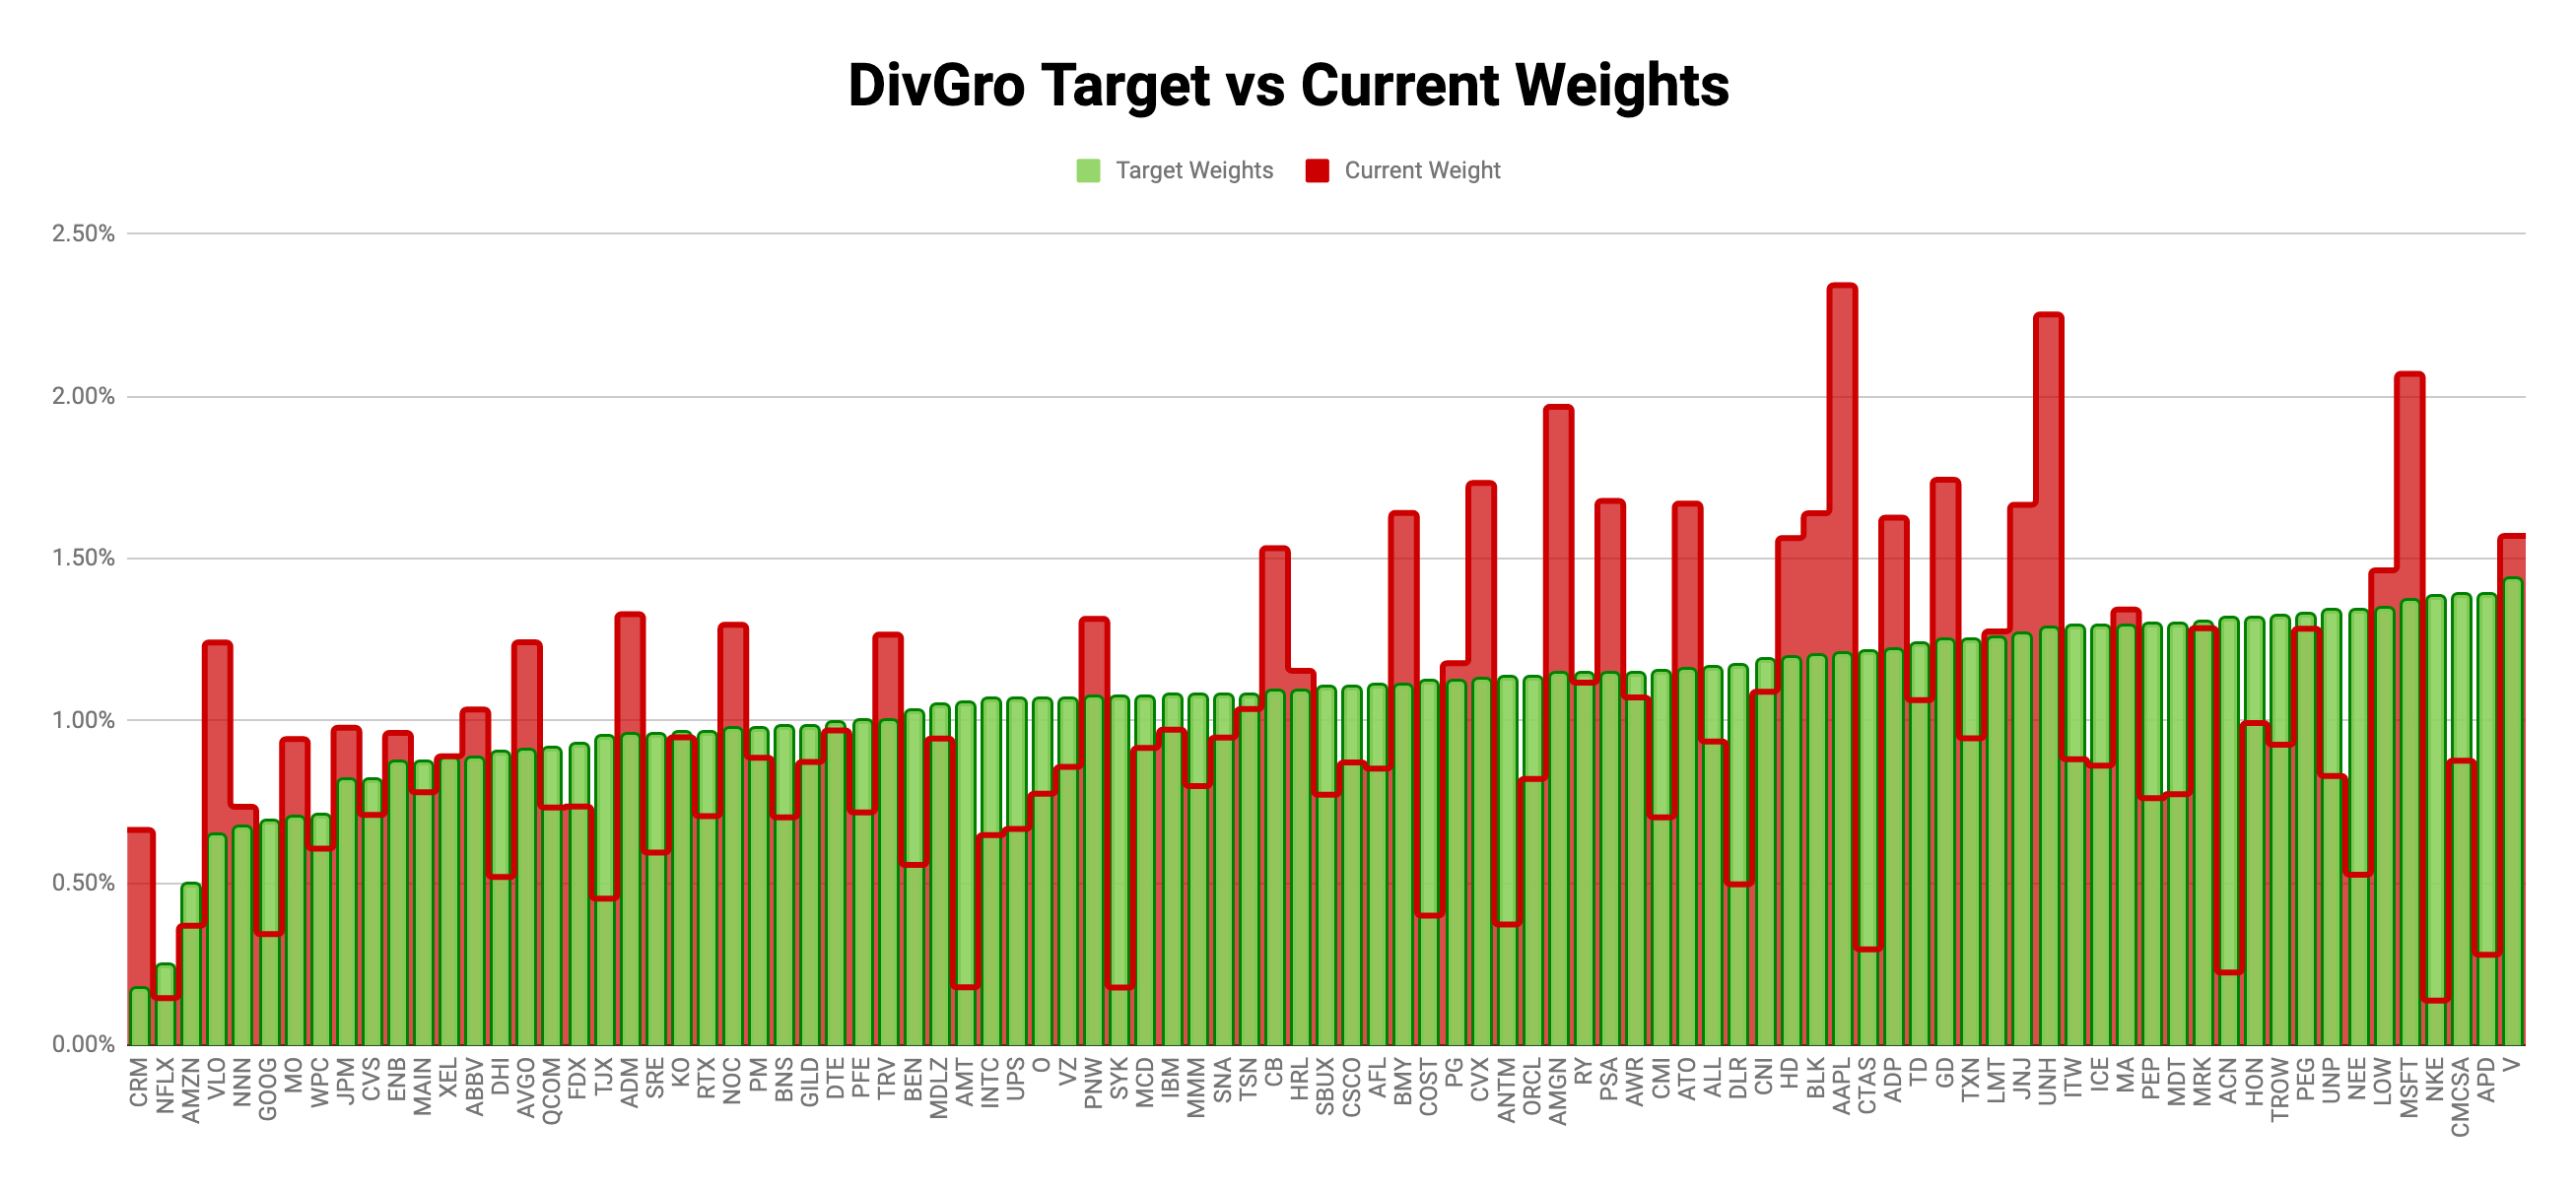
I'm not really interested in trimming positions to bring them back into "compliance," especially for positions in my taxable account. Rather, I'll favor buying more shares of underweight positions to fill any gaps from below.
I'm continuing my theme of increasing DivGro's exposure to the Defensive Sectors. Below is a chart showing the current distribution with an insert of last month's distribution.

Markets
Here is a summary of various market indicators, showing the changes over the last month:
|
DOW 30 |
S&P 500 |
NASDAQ Composite |
10-YR BOND |
CBOE VIX |
|
| Feb 28, 2022 | 33,892.60 | 4,373.94 | 13,751.40 | 1.839 | 30.15 |
| Mar 31, 2022 | 34,678.35 | 4,530.41 | 14,220.52 | 2.327 | 20.56 |
In March, the DOW 30 gained 2.3%, the S&P 500 gained 3.6%, and the NASDAQ gained 3.4%. The yield on the benchmark 10-year Treasury note rose to 2.327, while CBOE's measure of market volatility, the VIX dropped 31.8% to 20.56.

Portfolio Statistics
Given DivGro's current market value and the total capital invested, the portfolio has returned about 124% since inception. But calculating the IRR (internal rate of return) gives a better measure of portfolio performance, as IRR takes into account the timing and size of deposits since inception. DivGro's IRR is 15.7%.)
I track the yield on cost (YoC) for individual stocks, as well as an average YoC for my portfolio. DivGro's average YoC increased from 4.06% last month to 4.17% this month.
Percentage payback relates dividend income to the amount of capital invested. DivGro's average percentage payback is 28.1%, up from last month's 27.7%.
Finally, DivGro's projected annual yield is calculated by dividing PADI ($42,546) by the total amount invested. DivGro's projected annual yield is at 6.95%, up from last month's value of 6.68%.
The following chart shows DivGro's market value breakdown. Dividends are plotted at the base of the chart so we can see them grow over time:

Looking Ahead
I'm hoping to tackle my first quarterly review in the next week or so, followed shortly by my April monthly review.
Please see my Performance page for various visuals summarizing DivGro's performance.
You can now follow me on Twitter and Facebook.
No comments :
Post a Comment
Please don't include links in comments. I will mark such comments as spam and the comment won't be published. To make me aware of your blog or website, comment on my Blogrole page instead.