
Welcome to another monthly review of DivGro, my portfolio of dividend growth stocks!
The goal of these reviews is to provide a summary of dividends received and to detail buy and sell transactions. Additionally, I look at how the month's activities have impacted DivGro's projected annual dividend income (PADI).
In May, I opened one new position and added shares to one existing position. Both these transactions resulted from options assignments. Five DivGro stocks announced dividend increases in May. The net result of these changes is that PADI increased by about 1.6% in May. Year over year, PADI increased by 27.6%.
As for dividend income, in May I received dividends totaling $2,433 from 26 stocks in my portfolio, a year-over-year increase of 28%. So far in 2022, I've collected $18,589 in dividends, or about 43% of my 2022 goal of $43,200.
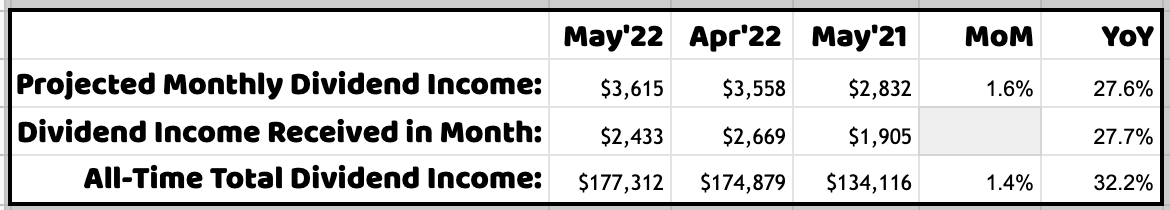
Assuming the status quo and given DivGro's PADI of $43,383, I can expect to receive $3,615 in dividend income per month, on average, in perpetuity. Of course, most of the stocks I own are dividend growers, so I expect my dividend income to increase over time! Furthermore, I plan to reinvest dividends until I retire, so DivGro's PADI should continue to grow through dividend growth and through compounding.
Dividend Income
I received dividends from 26 different stocks, for a monthly total of $2,433 in dividend income:

Following is a list of the dividends I collected in May:
- Apple Inc (AAPL) — income of $46.00
- AbbVie Inc (ABBV) — income of $141.00
- Accenture plc (ACN) — income of $9.70
- Virtus AllianzGI Artificial Intelligence & Technology Opportunities Fund (AIO) — income of $120.00
- Air Products and Chemicals, Inc (APD) — income of $25.92
- Bristol-Myers Squibb Company (BMY) — income of $162.00
- BlackRock Science and Technology Trust (BST) — income of $100.00
- Costco Wholesale Corporation (COST) — income of $9.00
- CVS Health Corporation (CVS) — income of $55.00
- D.R. Horton, Inc (DHI) — income of $22.50
- Eaton Vance Tax-Advantaged Global Dividend Opportunities Fund (ETO) — income of $224.00
- Eaton Vance Tax-Advantaged Dividend Income Fund (EVT) — income of $203.25
- General Dynamics Corporation (GD) — income of $126.00
- Hormel Foods Corporation (HRL) — income of $78.00
- JPMorgan Chase & Co (JPM) — income of $110.00
- Lowe's Companies, Inc (LOW) — income of $80.00
- Mastercard Incorporated (MA) — income of $24.50
- Main Street Capital (MAIN) — income of $55.90
- National Retail Properties, Inc (NNN) — income of $119.25
- Realty Income Corporation (O) — income of $37.05
- The Procter & Gamble Company (PG) — income of $91.33
- Royal Bank of Canada (RY) — income of $140.00
- Starbucks Corporation (SBUX) — income of $68.60
- The Toronto-Dominion Bank (TD) — income of $138.05
- Texas Instruments Incorporated (TXN) — income of $86.25
- Verizon Communications Inc (VZ) — income of $160.00
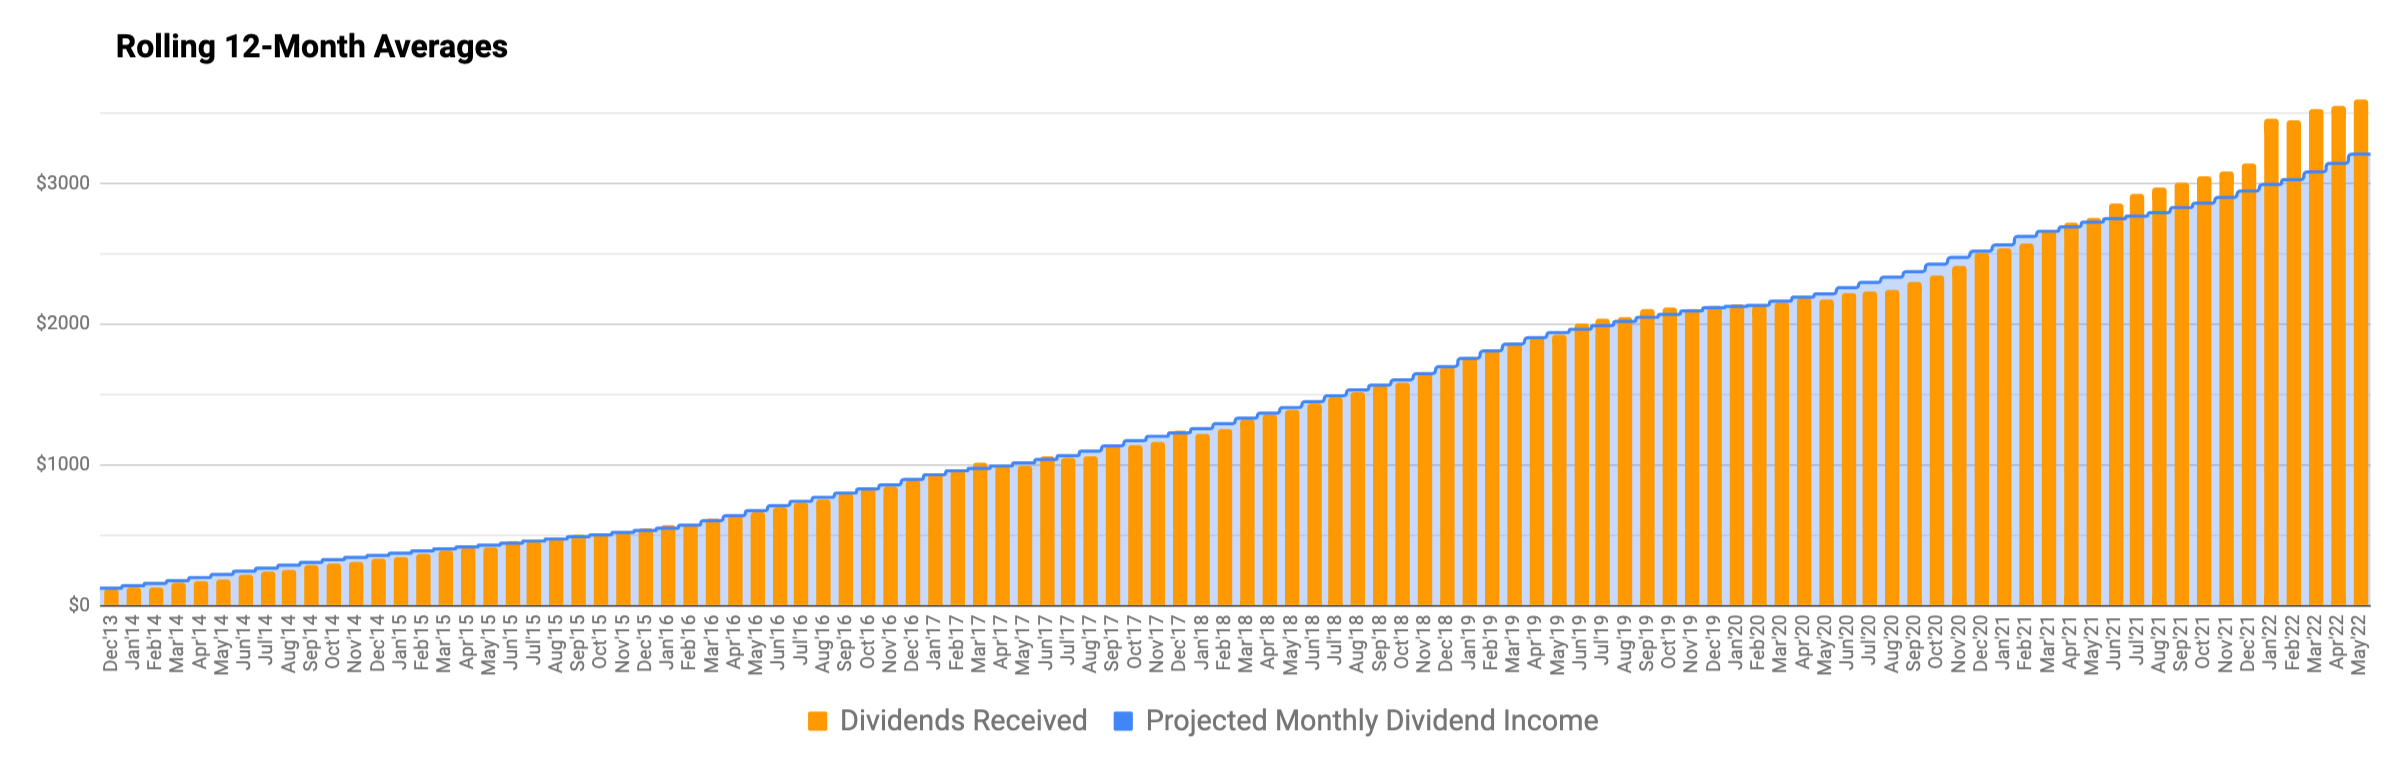
The following chart shows DivGro's monthly dividends plotted against PMDI. Quarter-ending months are huge outliers:

For this reason, I create a rolling 12-month average of dividends received (the orange bars) plotted against a rolling 12-month average of PMDI (the blue, staggered line):
Dividend Changes
In May, the following stocks announced dividend increases or paid higher dividends due to exchange-rate fluctuations:
- Chubb Limited (CB) — increase of 3.75%
- Lowe's Companies, Inc (LOW) — increase of 31.25%
- Medtronic plc (MDT) — increase of 7.94%
- Royal Bank of Canada (RY) — increase of 0.12%
- Union Pacific Corporation (UNP) — increase of 10.17%
- The Toronto-Dominion Bank (TD) — decrease of 1.28%
Overall, these changes will increase DivGro's PADI by about $149.
I like seeing dividend increases above 7%, so two of the five increases top my expectations. The arithmetic average of this month's dividend increases is 8.66%, which barely beats the current rate of inflation of 8.6%.
Transactions
Here is a summary of my transactions in May:
- PACCAR Inc (PCAR) — new position of 100 shares
- JPMorgan Chase & Co (JPM) — added 100 shares and increased position to 210 shares
These transactions increased DivGro's PADI by about $536.
Both transactions resulted from the assignment of options.
PACCAR (PCAR)
On 20 May 2022, the $80.00 put option I'd sold on PCAR was assigned, meaning I had to buy 100 shares of PCAR at $80 per share. PCAR now trades above $85 per share and my fair value estimate of PCAR is $94, so I'm thrilled with this assignment!
PCAR is rated Fine with a DVK Quality Score of 20:

The stock yields 1.54% at $85.63 per share and has a 5-year dividend growth rate of 6.9%.
The yield seems low, but I should note that PCAR regularly pays a special dividend, which sometimes is significant. Here are special dividends and regular quarterly dividend totals for the past five years:
| Year | Regular | Special |
| 2021 | $1.34 | $1.50 |
| 2020 | $1.28 | $0.70 |
| 2019 | $1.28 | $2.30 |
| 2018 | $1.09 | $2.00 |
| 2017 | $0.99 | $1.20 |
JPMorgan Chase (JPM)
On 20 May 2022, the $120 put option I'd sold on JPM was assigned, meaning I had to buy 100 shares of JPM at $120 per share. JPM now trades just above $120 per share and my fair value estimate of JPM is $146, so I'm OK with this assignment!
JPM is rated Decent with a DVK Quality Score of 18:

The stock yields 3.13% at $120.03 per share and has a 5-year dividend growth rate of 15%.
Portfolio Diversification
I'm continuing to slowly rebalance DivGro between Defensive, Sensitive, and Cyclical supersectors. Below is a chart showing the current distribution with an insert of last month's distribution.


Markets
It is worth looking at the markets to understand the environment we're investing in, even though I no longer compare DivGro's performance to those of the markets:
|
DOW 30 |
S&P 500 |
NASDAQ Composite |
10-YR BOND |
CBOE VIX |
|
| Apr 30, 2022 | 32,977.21 | 4,131.93 | 12,334.64 | 2.887 | 33.40 |
| May 31, 2022 | 32,990.12 | 4,132.15 | 12,081.39 | 2.844 | 26.19 |
In May, the DOW 30 and the S&P 500 essentially remained flat, while the tech-heavy NASDAQ dropped 2.1%. The yield on the benchmark 10-year Treasury note fell to 2.844%, while CBOE's measure of market volatility, the VIX decreased by about 22% to 26.19.
Following is a chart showing how the stocks and funds in DivGro performed over the past month:


Portfolio Statistics
Based on the total capital invested and the portfolio's current market value, DivGro has delivered a simple return of about 115% since inception. In comparison, DivGro's IRR (internal rate of return) is 14.7%. (IRR takes into account the timing and size of deposits since inception, so it is a better measure of portfolio performance).
I track the yield on cost (YoC) for individual stocks, as well as an average YoC for my portfolio. DivGro's average YoC decreased from 4.18% last month to 4.17% this month.
Another interesting statistic is percentage payback, which relates dividend income to the amount of capital invested. DivGro's average percentage payback is 28.4%, down from last month's 28.5%.
Finally, projected annual yield is calculated by dividing PADI ($43,383) by the total amount invested. DivGro's projected annual yield is at 6.92%, down from last month's value of 6.96%.
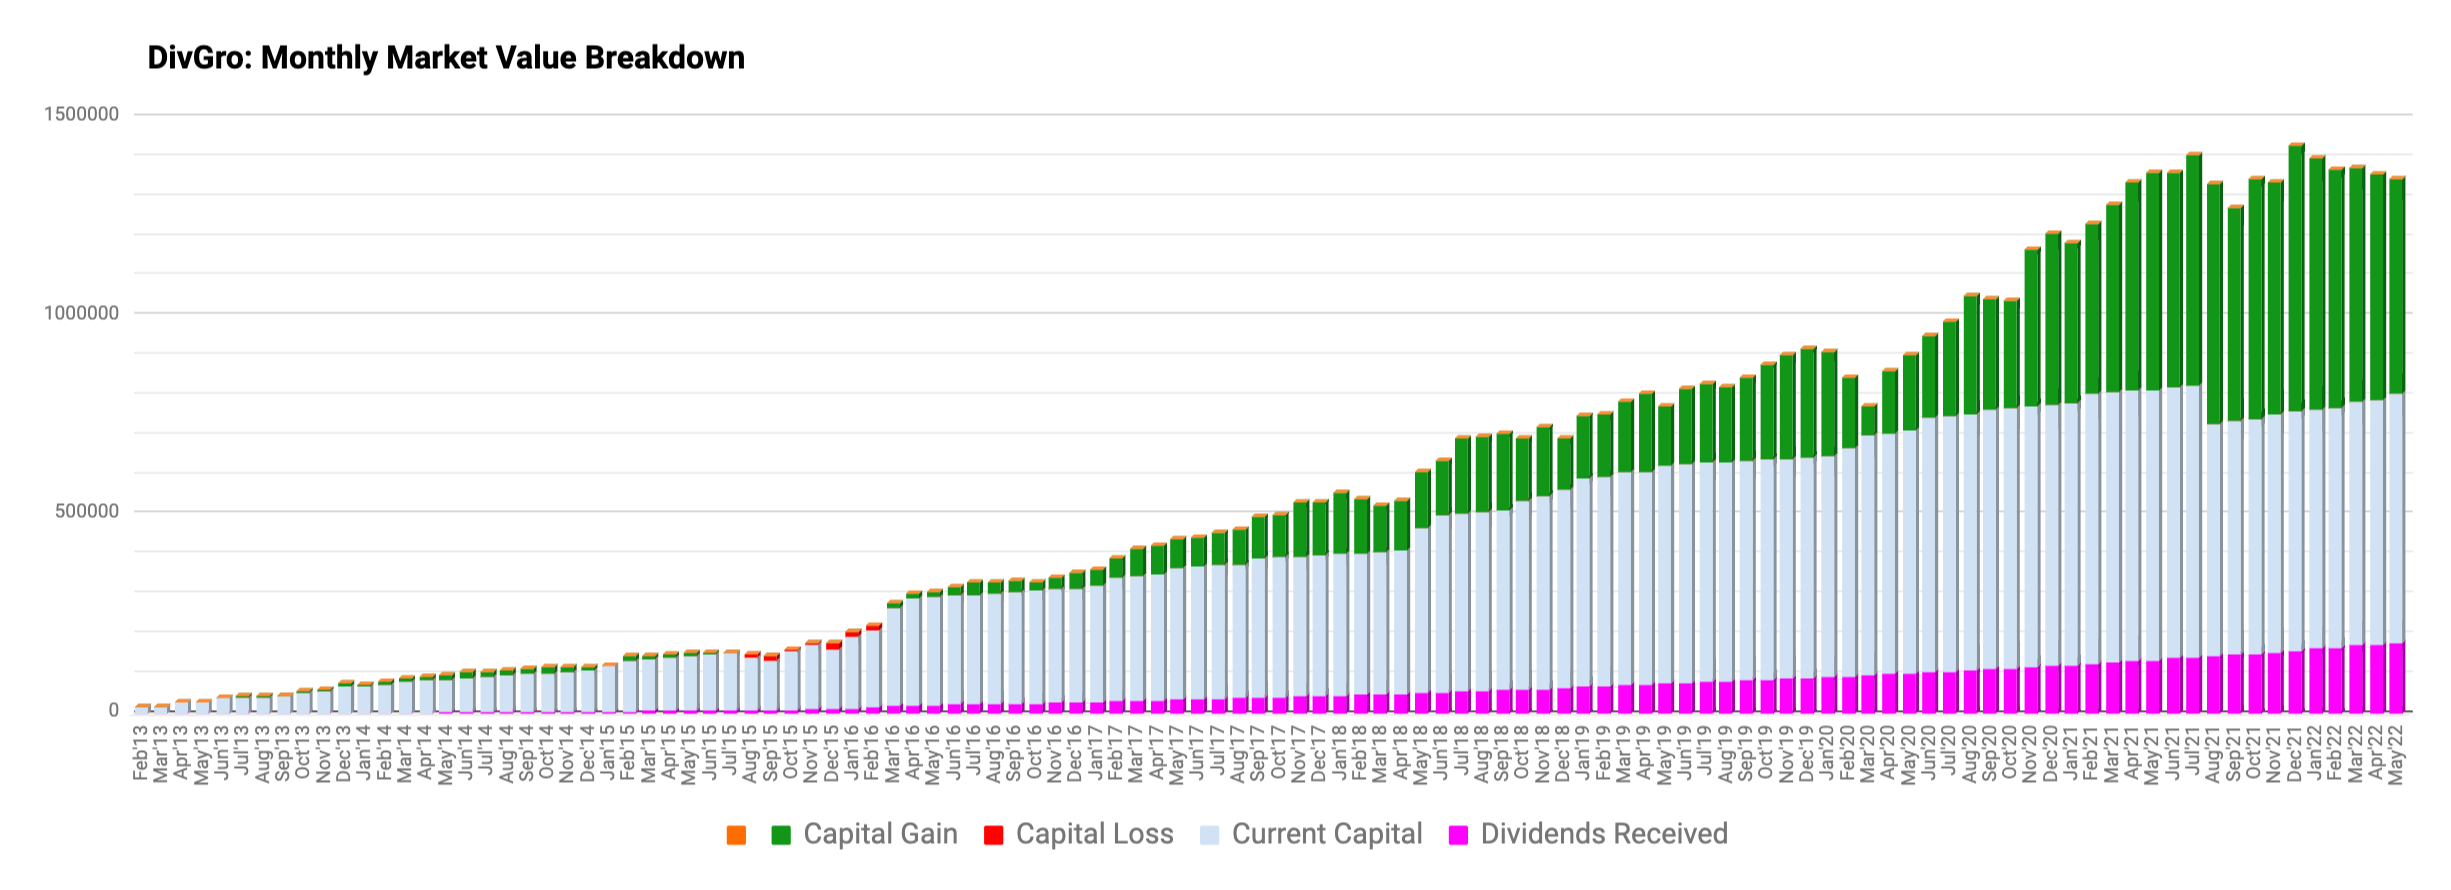
Here's a chart showing DivGro's market value breakdown. Dividends are plotted at the base of the chart so we can see them grow over time:
Looking Ahead
June is a quarter-ending month and those always produce huge dividend income totals!
Please see my Performance page for various visuals summarizing DivGro's performance.
You can now follow me on Twitter and Facebook.
No comments :
Post a Comment
Please don't include links in comments. I will mark such comments as spam and the comment won't be published. To make me aware of your blog or website, comment on my Blogrole page instead.