
Welcome to the August review of DivGro, my portfolio of dividend growth stocks.
These reviews aim to provide a summary of dividends received and to detail buy and sell transactions. Additionally, I look at how the month's activities have impacted DivGro's projected annual dividend income (PADI).
This month, I opened two new positions and added shares to four existing positions. Additionally, I closed one position and reduced my holdings in two positions. Three DivGro stocks announced dividend increases in August. The net result of these changes is that PADI increased by about 0.7% in August. Year over year, PADI increased by 31.5%.
As for dividend income, in August, I received dividends totaling $3,239 from 27 stocks in my portfolio, a year-over-year increase of 53%. So far in 2022, I've collected $30,253 in dividends, or about 70% of my 2022 goal of $43,200.

Assuming the status quo and given DivGro's PADI of $45,203, I can expect to receive $3,767 in dividend income per month, on average, in perpetuity. Of course, most of the stocks I own are dividend growers, so I expect my dividend income to increase over time! Furthermore, I plan to reinvest dividends until I retire, so DivGro's PADI should continue to grow through dividend growth and through compounding.
Dividend Income
In August, I received a total of $3,239 in dividend income from 27
different stocks:
Here is a list of the dividends I collected in August:
- Apple Inc (AAPL) — income of $46.00
- AbbVie Inc (ABBV) — income of $141.00
- Accenture plc (ACN) — income of $9.70
- Virtus Artificial Intelligence & Technology Opportunities Fund (AIO) — income of $120.00
- Air Products and Chemicals, Inc (APD) — income of $25.92
- Bristol-Myers Squibb Company (BMY) — income of $162.00
- BlackRock Science and Technology Trust (BST) — income of $100.00
- Costco Wholesale Corporation (COST) — income of $9.00
- CVS Health Corporation (CVS) — income of $55.00
- D.R. Horton (DHI) — income of $22.50
- Eaton Vance Tax-Advantaged Global Dividend Opportunities Fund (ETO) — income of $224.00
- Eaton Vance Tax-Advantaged Dividend Income Fund (EVT) — income of $203.25
- General Dynamics Corporation (GD) — income of $126.00
- Hormel Foods Corporation (HRL) — income of $78.00
- JPMorgan Chase & Co (JPM) — income of $210.00
- Lowe's Companies, Inc (LOW) — income of $105.00
- Mastercard Incorporated (MA) — income of $24.50
- Main Street Capital (MAIN) — income of $55.90
- National Retail Properties, Inc (NNN) — income of $110.00
- Realty Income Corporation (O) — income of $37.13
- The Procter & Gamble Company (PG) — income of $91.33
- Public Storage (PSA) — income of $591.75
- Royal Bank of Canada (RY) — income of $147.86
- Starbucks Corporation (SBUX) — income of $98.00
- The Toronto-Dominion Bank (TD) — income of $138.56
- Texas Instruments Incorporated (TXN) — income of $115.00
- Verizon Communications Inc (VZ) — income of $192.00
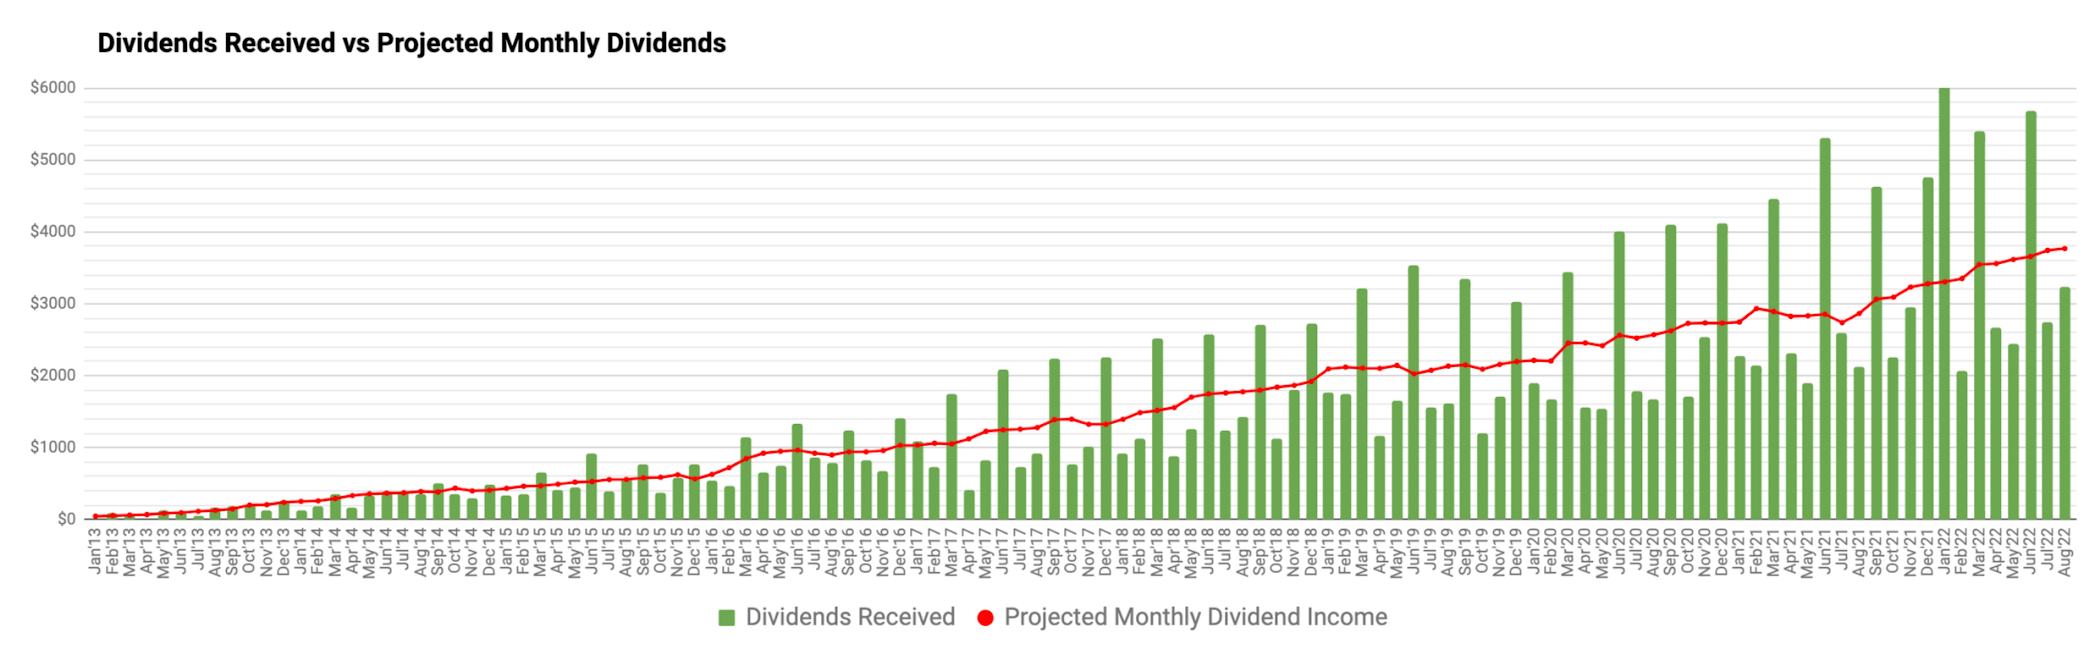
The chart below shows DivGro's monthly dividends plotted against PMDI. Clearly, quarter-ending months are huge outliers:
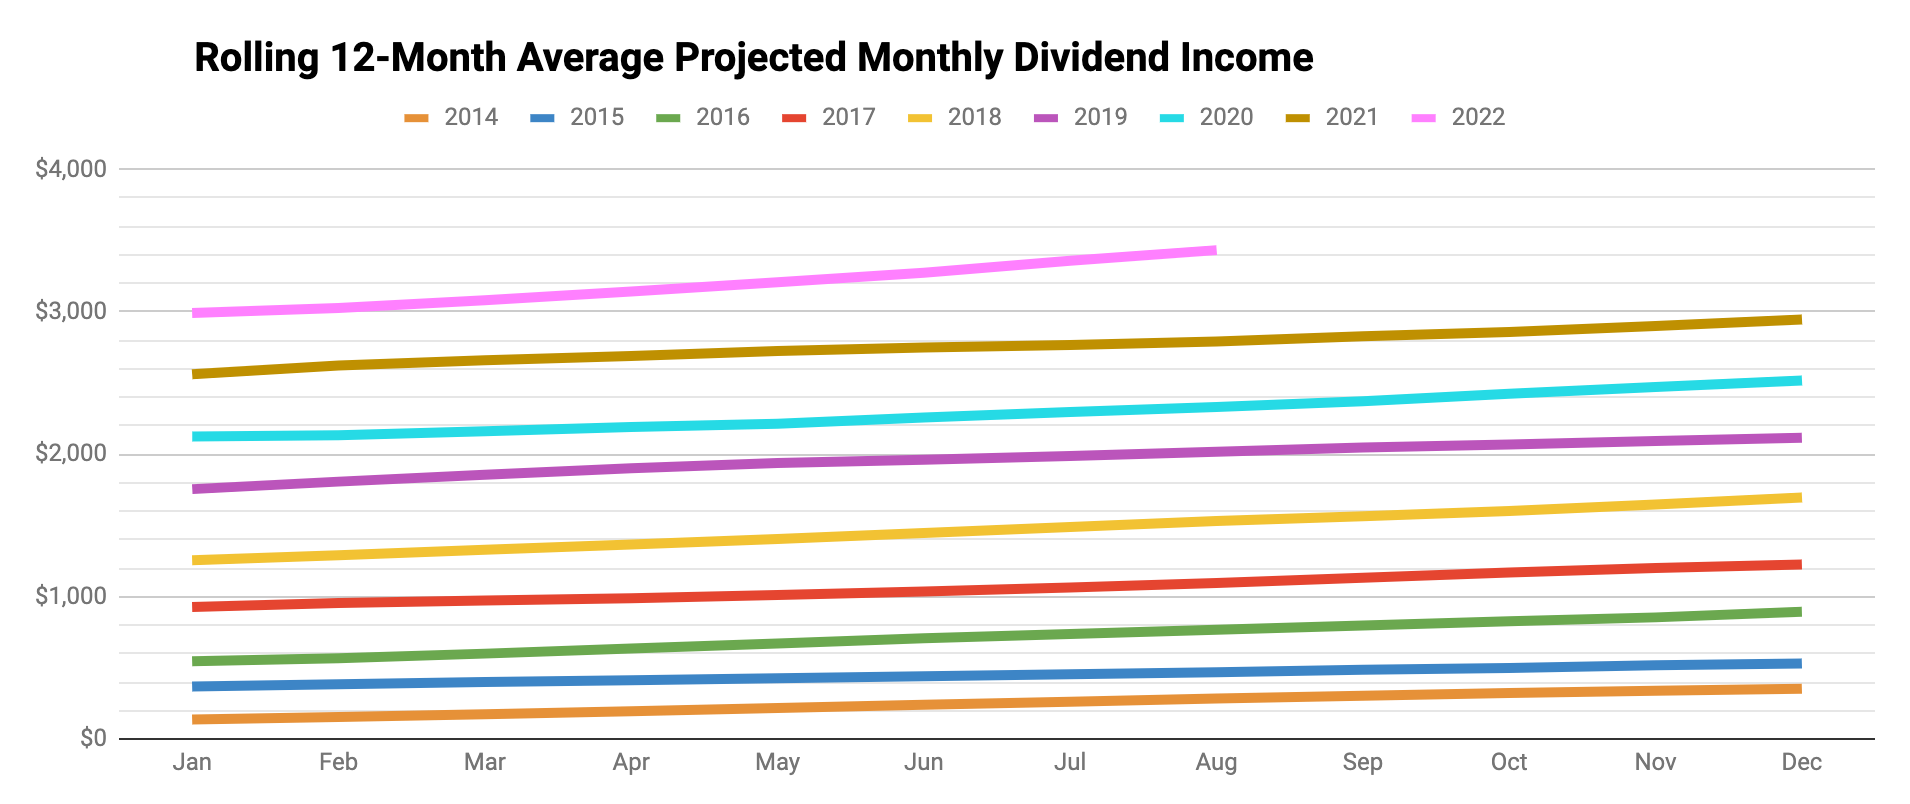
To smooth things out a bit, I create a rolling 12-month average of dividends received (the orange bars) plotted against a rolling 12-month average of PMDI (the blue, staggered line):

While it would be great if dividends were distributed more evenly, I don't want to change my investment decisions based on the timing or frequency of dividend payments.
Dividend Changes
In August, the following stocks announced dividend increases or paid higher dividends (perhaps due to exchange rate fluctuations):
- Altria Group, Inc (MO) — an increase of 4.44%
- Royal Bank of Canada (RY) — an increase of 5.61%
- The Toronto-Dominion Bank (TD) — an increase of 0.37%
As a result of these changes, DivGro's PADI will increase by $70.
I like seeing dividend increases above 7%. Unfortunately, none of these increases measures up. The arithmetic average of this month's dividend increases is 3.48%, which easily beats inflation.
Transactions
Here is a summary of my transactions in August:
New Positions
- BlackRock MuniHoldings California Quality Fund (MUC) — new position of 1,000 shares
- WEC Energy Group (WEC) — new position of 70 shares
- 10% bracket: Yte = 5.85% ÷ (1 − 10%) = 6.50%
- 12% bracket: Yte = 5.85% ÷ (1 − 12%) = 6.65%
- 22% bracket: Yte = 5.85% ÷ (1 − 22%) = 7.50%
- 24% bracket: Yte = 5.85% ÷ (1 − 24%) = 7.80%
- 32% bracket: Yte = 5.85% ÷ (1 − 32%) = 8.60%
- 35% bracket: Yte = 5.85% ÷ (1 − 35%) = 9.00%
- 37% bracket: Yte = 5.85% ÷ (1 − 37%) = 9.29%
,%20Non-GAAP%20EPS).png)
-
Franklin Resources, Inc
(BEN)
— sold 300 shares and closed the position -
D.R. Horton
(DHI)
— sold 100 shares and closed position -
Gilead Sciences, Inc
(GILD)
— sold 200 shares and closed the position -
Valero Energy Corporation
(VLO)
— sold 150 shares and closed the position
-
Virtus Artificial Intelligence & Technology Opportunities Fund
(AIO)
— added 400 shares and increased my position to 1,200 shares -
BlackRock Science and Technology Trust
(BST)
— added 200 shares and increased my position to 600 shares -
Cisco Systems, Inc
(CSCO)
— added 100 shares and increased my position to 300 shares -
Intel Corporation
(INTC)
— added 80 shares and increased my position to 280 shares
-
JPMorgan Chase & Co
(JPM)
— sold 110 shares and reduced my position to 100 shares -
Pinnacle West Capital Corporation
(PNW)
— sold 50 shares and reduced my position to 200 shares
All these transactions increased DivGro's PADI by about $233.
Portfolio Diversification


Markets
It is worth looking at the markets to understand the environment we're investing in:
|
DOW 30 |
S&P 500 |
NASDAQ Composite |
10-YR BOND |
CBOE VIX |
|
| Jul 31, 2022 | 32,845.13 | 4,130.29 | 12,390.69 | 2.642 | 21.33 |
| Aug 31, 2022 | 31,510.43 | 3,955.00 | 11,816.20 | 3.133 | 25.87 |
In August, the DOW 30 dropped 4.1%, the S&P 500 dropped 4.2%, and the NASDAQ dropped 4.6%. The yield on the benchmark 10-year Treasury note rose to 3.133, while CBOE's measure of market volatility, the VIX, increased by 21.3% to 25.87.


Portfolio Statistics
Given DivGro's current market value and the total capital invested, the portfolio has returned about 112% since inception. But calculating the IRR (internal rate of return) gives a better measure of portfolio performance, as IRR considers the timing and size of deposits since inception. DivGro's IRR is 14.0%.)
I track the yield on cost (YoC) for individual stocks, as well as an average YoC for my portfolio. DivGro's average YoC increased from 4.17% last month to 4.29% this month.
Another interesting statistic is percentage payback, which relates dividend income to the amount of capital invested. DivGro's average percentage payback is 29.7%, up from last month's 29.2%.
Finally, DivGro's projected annual yield is at 7.10%, up from last month's value of 7.05%. I calculate the projected annual yield by dividing PADI ($45,203) by the total amount invested.
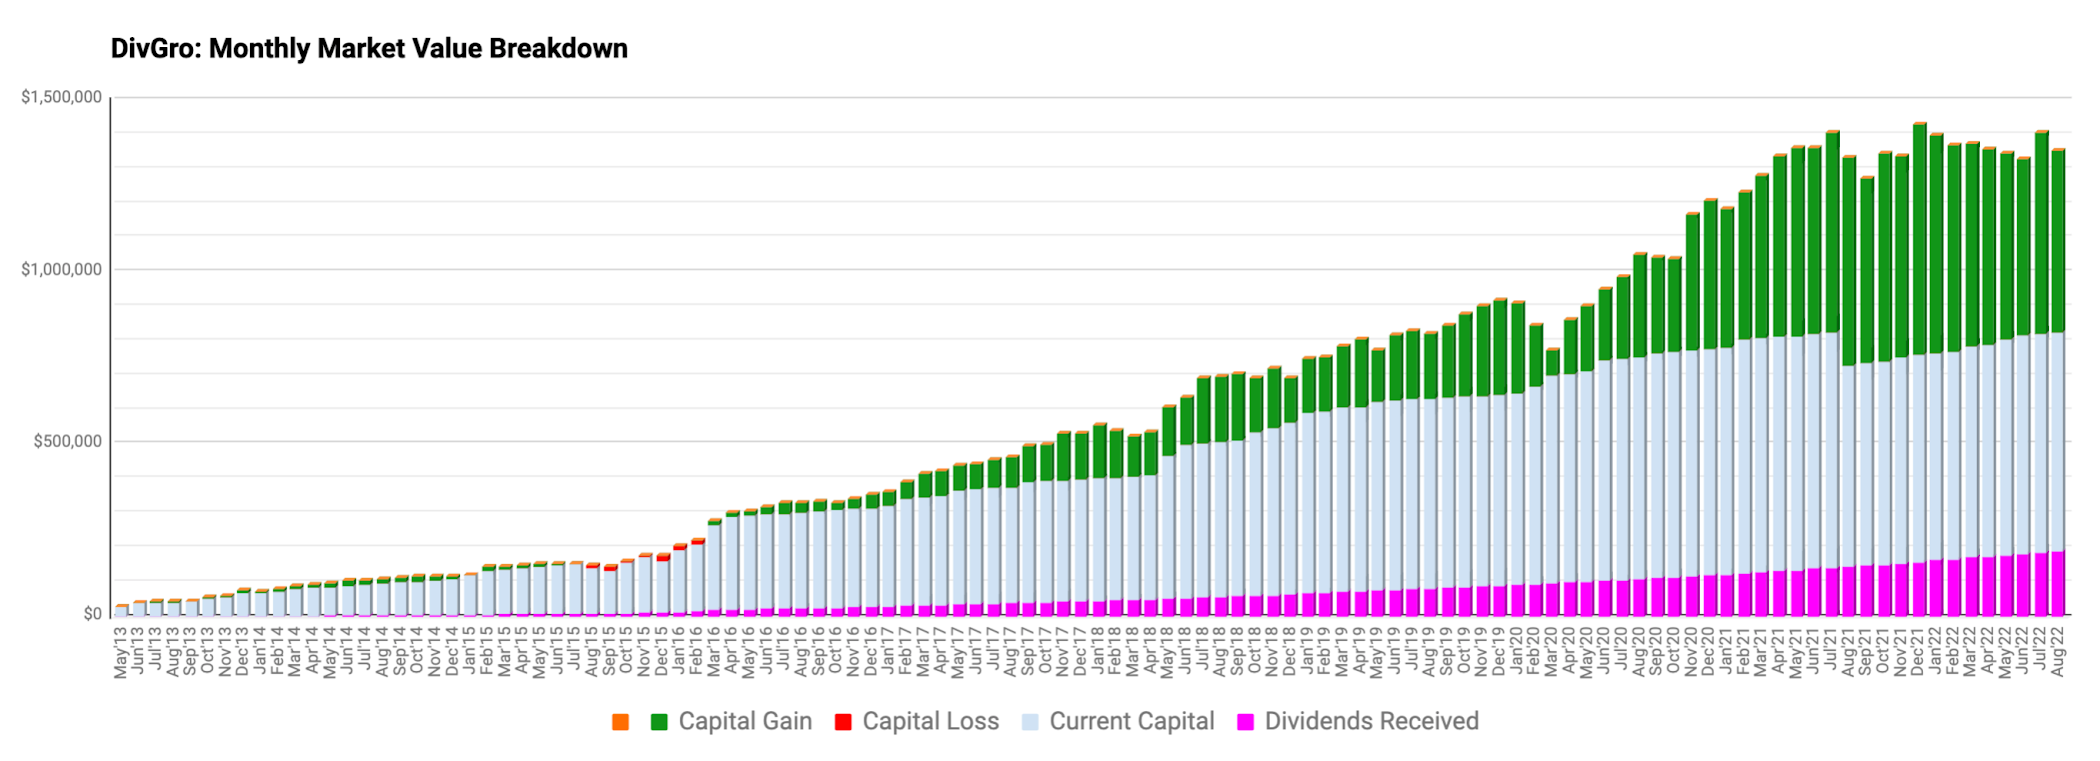
Here's a chart showing DivGro's market value breakdown. Dividends are plotted at the base of the chart so we can see them grow over time:
Looking Ahead
The markets are quite volatile, with high inflation and fears of a possible worldwide recession playing on the psyche of investors. As a dividend growth investor, I'm not overly concerned about increased volatility. If the market drops, I can buy more shares for the same money!
I'm looking forward to September's dividend income, as my quarter-ending totals often set new record highs for monthly dividend income. It is unlikely that September's dividend total will top January's record, which included several special dividends.
Please see my Performance page for various visuals summarizing DivGro's performance.
You can now follow me on Twitter and Facebook.
Some minor remarks. According to the linked article, your best pick in the energy sector was EOG, not CVX. I'm also not sure if 3.48% easily beats inflation nowadays. Good luck and hope you do well close to retirement. If I had your portfolio, I could already retire right now in my thirties!
ReplyDeleteFair enough. $CVX now is my top Energy sector pick.
DeleteYou're right, 3.48% does not easily beat inflation. Of course, with Dividend Growth stocks you need to look beyond the current yield and include the (long-term) impact of dividend growth (and, possibly, dividend reinvestment).
We live in one of the highest cost-of-living regions in America. We could retire if me moved elsewhere. Further, I enjoy my work and so does one of my colleagues, who's still working at age 70.