 Welcome to the 39th quarterly review of DivGro, my portfolio of
dividend growth stocks.
Welcome to the 39th quarterly review of DivGro, my portfolio of
dividend growth stocks.Quarterly reviews provide a summary of dividend income, dividend changes, and transactions executed in the past quarter. I also provide some charts showing various portfolio statistics. These reviews are mostly informational and help me to track progress over time.
This quarter, DivGro generated more than $11,780 in dividend income, and I'm projecting dividend income of at least $11,930 per quarter going forward.
Year-to-date, I've collected dividend income of $36,056, or about 83% of my 2022 goal of $43,200. DivGro's all-time dividend income total is $194,779.

Dividend Income
In Q3-2022, I collected dividend income totaling $11,789, up 9% from the dividends received in Q2-2022 and up 26% from the dividends received in Q3-2021.
I received quarterly dividends from 88 different stocks and funds:
- Apple Inc (AAPL) — income of $46.00
- AbbVie Inc (ABBV) — income of $141.00
- Accenture plc (ACN) — income of $9.70
- Archer-Daniels-Midland Company (ADM) — income of $80.00
- Automatic Data Processing, Inc (ADP) — income of $104.00
- Aflac Incorporated (AFL) — income of $80.00
- The Allstate Corporation (ALL) — income of $85.00
- Amgen Inc (AMGN) — income of $223.10
- American Tower Corporation (AMT) — income of $14.30
- Air Products and Chemicals, Inc (APD) — income of $25.92
- Atmos Energy Corporation (ATO) — income of $136.00
- Broadcom Inc (AVGO) — income of $123.00
- American States Water Company (AWR) — income of $79.50
- Franklin Resources, Inc (BEN) — income of $87.00
- BlackRock, Inc (BLK) — income of $170.80
- Bristol-Myers Squibb Company (BMY) — income of $162.00
- The Bank of Nova Scotia (BNS) — income of $119.80
- Chubb Limited (CB) — income of $83.00
- Comcast Corporation (CMCSA) — income of $121.50
- Cummins Inc (CMI) — income of $157.00
- Costco Wholesale Corporation (COST) — income of $9.00
- Cisco Systems, Inc (CSCO) — income of $114.00
- Cintas Corporation (CTAS) — income of $11.50
- CVS Health Corporation (CVS) — income of $55.00
- Chevron Corporation (CVX) — income of $213.00
- D.R. Horton (DHI) — income of $22.50
- Digital Realty Trust, Inc (DLR) — income of $54.90
- DTE Energy Company (DTE) — income of $88.50
- Anthem, Inc (ELV) — income of $12.80
- Enbridge Inc (ENB) — income of $195.96
- FedEx Corporation (FDX) — income of $57.50
- General Dynamics Corporation (GD) — income of $126.00
- The Home Depot, Inc (HD) — income of $190.00
- Honeywell International Inc (HON) — income of $98.00
- Hormel Foods Corporation (HRL) — income of $78.00
- International Business Machines Corporation (IBM) — income of $165.00
- Intercontinental Exchange, Inc (ICE) — income of $38.00
- Intel Corporation (INTC) — income of $102.20
- Illinois Tool Works Inc (ITW) — income of $73.20
- Johnson & Johnson (JNJ) — income of $85.88
- JPMorgan Chase & Co (JPM) — income of $210.00
- The Coca-Cola Company (KO) — income of $88.00
- Lockheed Martin Corporation (LMT) — income of $112.00
- Lowe's Companies, Inc (LOW) — income of $105.00
- Mastercard Incorporated (MA) — income of $24.50
- McDonald's Corporation (MCD) — income of $69.00
- Mondelez International, Inc. (MDLZ) — income of $70.00
- Medtronic plc (MDT) — income of $68.00
- 3M Company (MMM) — income of $111.75
- Altria Group, Inc (MO) — income of $207.00
- Merck & Co., Inc (MRK) — income of $138.00
- Microsoft Corporation (MSFT) — income of $62.00
- NextEra Energy, Inc (NEE) — income of $42.50
- Virtus Equity & Convertible Income Fund (NIE) — income of $625.00
- NIKE, Inc (NKE) — income of $4.58
- National Retail Properties, Inc (NNN) — income of $110.00
- Northrop Grumman Corporation (NOC) — income of $69.20
- Oracle Corporation (ORCL) — income of $48.00
- PACCAR Inc (PCAR) — income of $34.00
- Public Service Enterprise Group Incorporated (PEG) — income of $135.00
- PepsiCo, Inc (PEP) — income of $69.00
- Pfizer Inc (PFE) — income of $80.00
- The Procter & Gamble Company (PG) — income of $91.33
- Philip Morris International Inc (PM) — income of $150.00
- Pinnacle West Capital Corporation (PNW) — income of $212.50
- Public Storage (PSA) — income of $681.75
- QUALCOMM Incorporated (QCOM) — income of $75.00
- Raytheon Technologies Corporation (RTX) — income of $55.00
- Royal Bank of Canada (RY) — income of $147.86
- Starbucks Corporation (SBUX) — income of $98.00
- Snap-on Incorporated (SNA) — income of $85.20
- Sempra (SRE) — income of $91.60
- Stryker Corporation (SYK) — income of $6.95
- The Toronto-Dominion Bank (TD) — income of $138.56
- The TJX Companies, Inc (TJX) — income of $29.50
- T Rowe PriceT. Rowe Price Group, Inc (TROW) — income of $120.00
- The Travelers Companies, Inc (TRV) — income of $93.00
- Tyson Foods, Inc (TSN) — income of $46.00
- Texas Instruments Incorporated (TXN) — income of $115.00
- UnitedHealth Group Incorporated (UNH) — income of $66.00
- Union Pacific Corporation (UNP) — income of $62.40
- United Parcel Service, Inc (UPS) — income of $76.00
- Visa Inc (V) — income of $37.50
- Valero Energy Corporation (VLO) — income of $147.00
- Verizon Communications Inc (VZ) — income of $192.00
- WEC Energy Group (WEC) — income of $50.93
- W. P. Carey Inc (WPC) — income of $105.90
- Xcel Energy Inc (XEL) — income of $80.44
- Virtus Artificial Intelligence & Technology Opportunities Fund (AIO) — income of $420.00
- BlackRock Science and Technology Trust (BST) — income of $350.00
- Eaton Vance Tax-Advantaged Global Dividend Opportunities Fund (ETO) — income of $672.00
- Eaton Vance Tax-Advantaged Dividend Income Fund (EVT) — income of $609.75
- Main Street Capital (MAIN) — income of $193.70
- BlackRock MuniHoldings California Quality Fund (MUC) — income of $55.00
- Realty Income Corporation (O) — income of $111.39

Dividend Changes
Last quarter, I reported projected annual dividend income (PADI) of $43,874. This quarter PADI increased to $45,683, topping my 2022 goal of increasing PADI to $45,000!
DivGro's average YOC is 4.31%, up from the 4.16% reported at the end of
Q2-2022.
Relative to the total capital invested, DivGro's projected annual yield is
7.17%, down from 6.90% at the end of Q2-2022.
The following table shows the stocks that announced dividend increases in
Q3-2022 or have paid a higher dividend than before. I've included the new
annual dividend and yield on cost [YOC]:
|
Company
|
Ticker
|
Increase | Annual Div |
New YoC
|
|
FedEx Corporation
|
FDX |
53.33% |
4.60
|
3.07% |
|
Cintas Corporation
|
CTAS |
21.05% |
4.60
|
1.17% |
|
Accenture plc
|
ACN |
15.46% |
4.48
|
2.55% |
|
Mondelez International, Inc.
|
MDLZ |
10.00% |
1.54
|
2.52% |
|
Microsoft Corporation
|
MSFT |
9.68% |
2.72
|
5.83% |
|
American States Water Company
|
AWR |
8.90% |
1.59
|
2.01% |
|
Cummins Inc
|
CMI |
8.28% |
6.28
|
4.07% |
|
Starbucks Corporation
|
SBUX |
8.16% |
2.12
|
3.13% |
|
Texas Instruments Incorporated
|
TXN |
7.83% |
4.96
|
4.56% |
|
Lockheed Martin Corporation
|
LMT |
7.14% |
12.00
|
3.87% |
|
Royal Bank of Canada
|
RY |
5.61% |
3.9429
|
4.41% |
|
Honeywell International Inc
|
HON |
5.10% |
4.12
|
2.71% |
|
Altria Group, Inc
|
MO |
4.44% |
3.76
|
8.15% |
|
National Retail Properties, Inc
|
NNN |
3.77% |
2.20
|
5.60% |
|
The Bank of Nova Scotia
|
BNS |
2.59% |
3.1947
|
5.38% |
|
American Tower Corporation
|
AMT |
2.14% |
5.88
|
2.21% |
|
Verizon Communications Inc
|
VZ |
1.95% |
2.61
|
5.05% |
|
Philip Morris International Inc
|
PM |
1.60% |
5.08
|
5.91% |
|
The Toronto-Dominion Bank
|
TD |
0.37% |
2.7712
|
4.90% |
|
Realty Income Corporation
|
O |
0.20% |
2.976
|
5.49% |
I like seeing dividend increases of at least 7%. This quarter, ten of the
dividend increases topped 7%, while the arithmetic average of all the
increases is 8.88%. That's a rate that outpaces the current rate of inflation
(8.2%).
Enbridge paid a smaller US$ dividend in Q3-2022:
Dividend Growth
Some stocks announce dividend increases more than once per year, so when considering dividend growth, it is better to look at year-over-year increases:

The arithmetic average year-over-year dividend growth rate of dividend-paying stocks in my portfolio is 7.59%, while my position-weighted average is 7.86%.
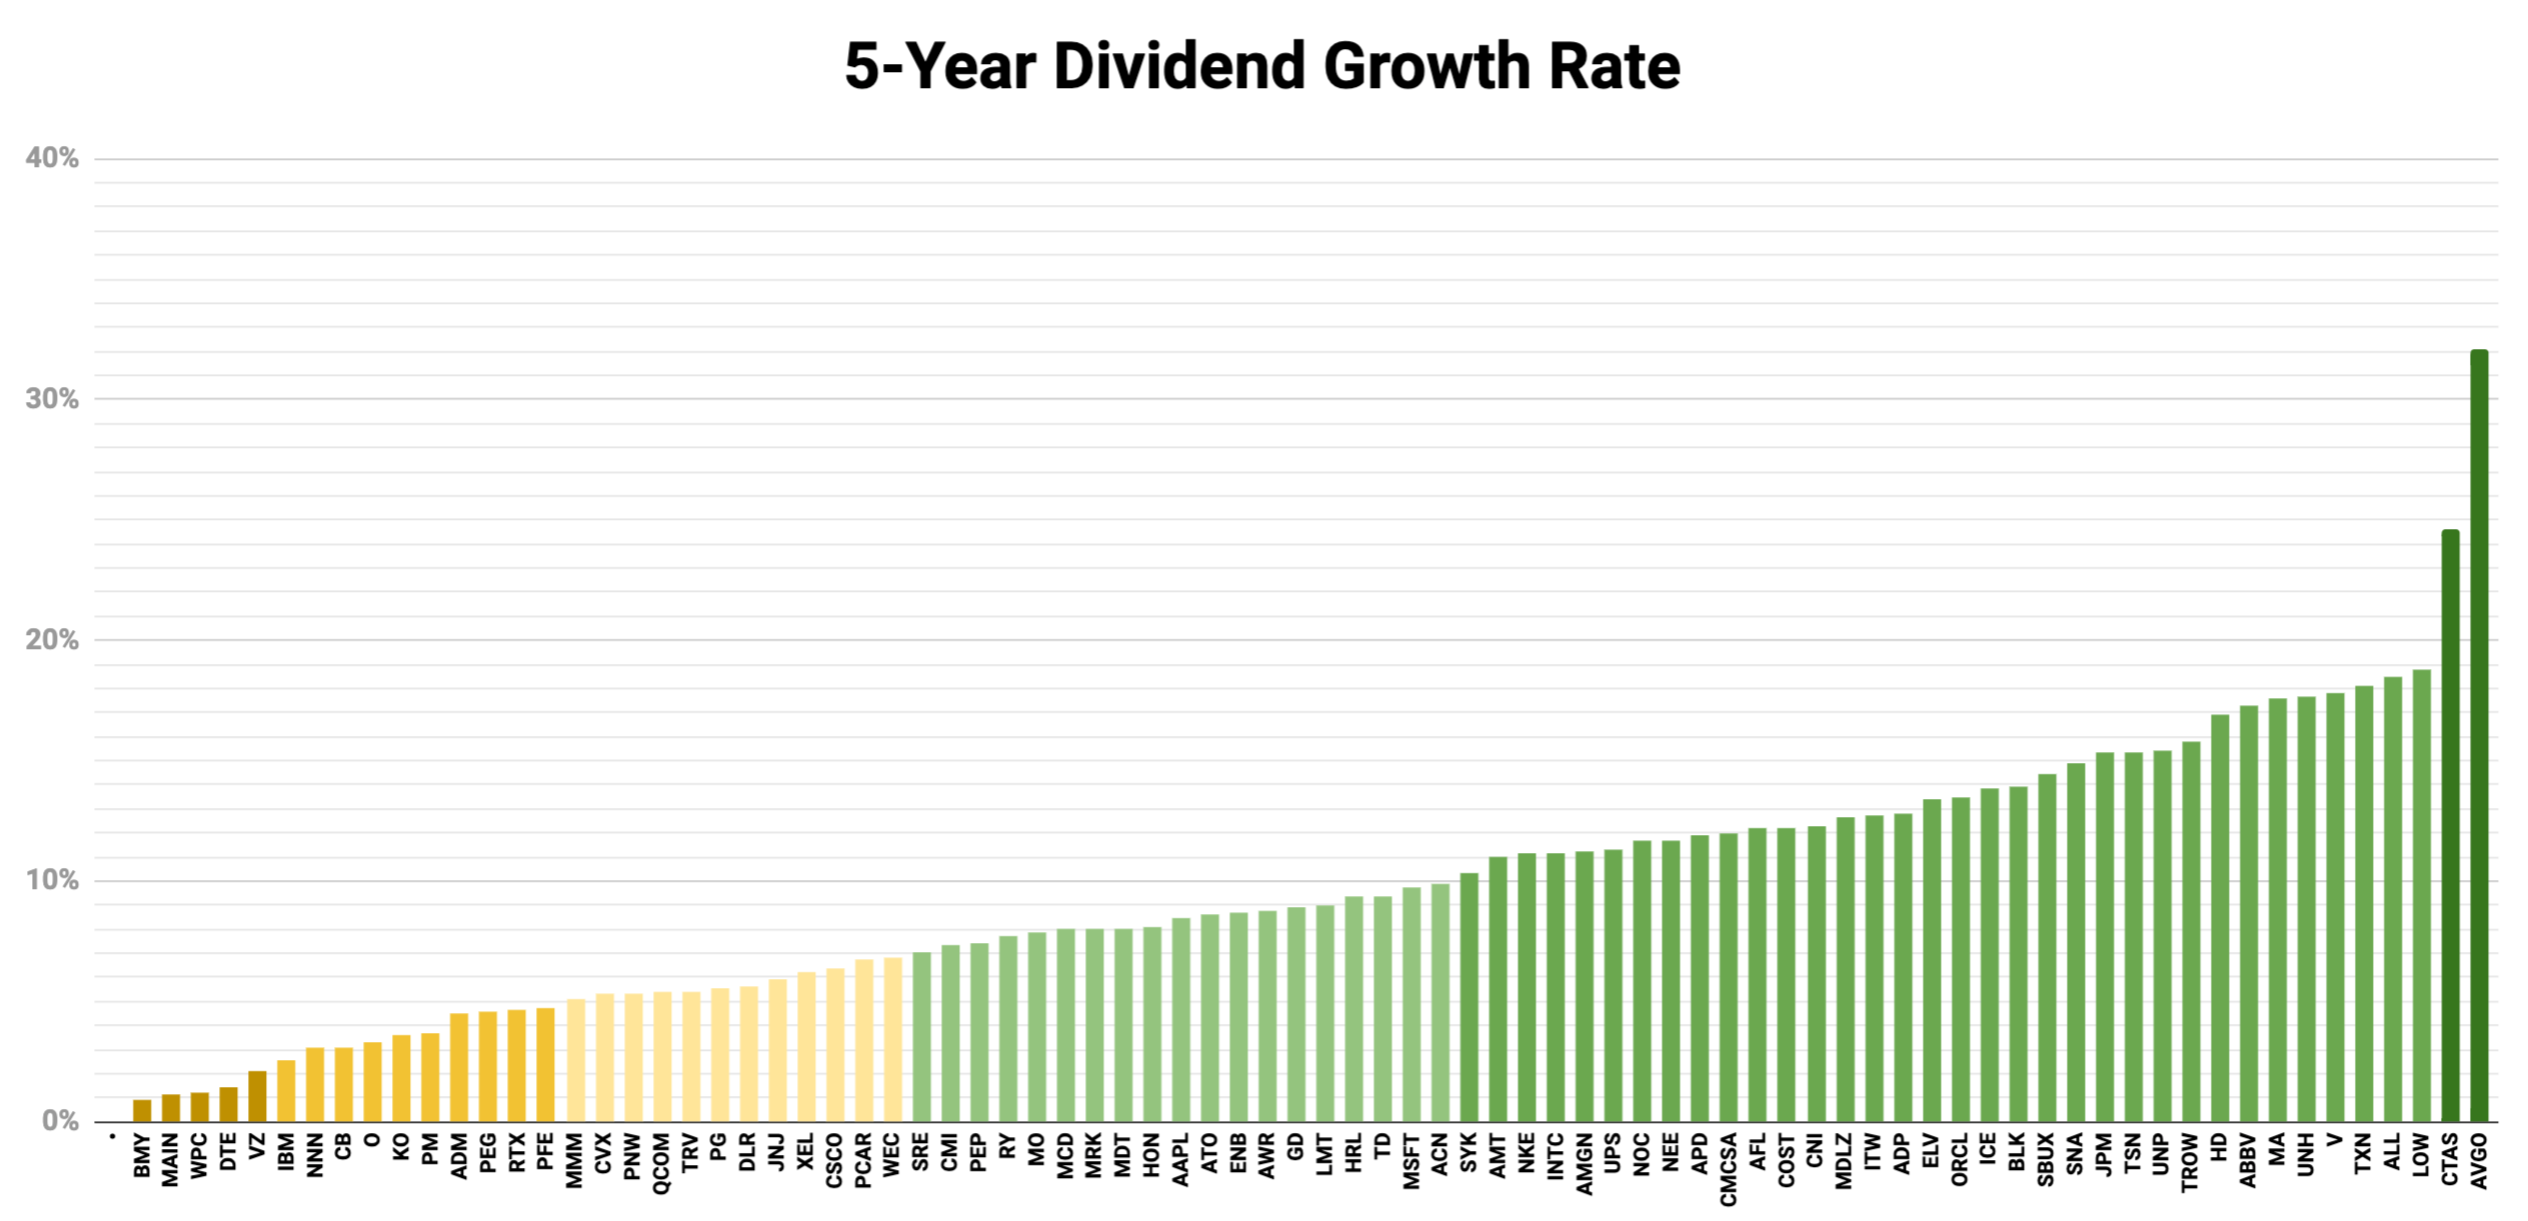
The arithmetic average of 5-year dividend growth rates of dividend-paying stocks in my portfolio is 9.75%, and the position-weighted average is 9.84%. Most DivGro's stocks have 5-year DGRs that exceed my target dividend growth rate of 7.00%! (These are colored green in the chart above.)
Transactions
This quarter I deployed new capital and options income as
follows:
New Positions
- BlackRock MuniHoldings California Quality Fund (MUC) — new position of 1,500 shares
- WEC Energy Group (WEC) — new position of 70 shares
- Franklin Resources, Inc (BEN) — sold 300 shares and closed position
- D.R. Horton (DHI) — sold 100 shares and closed position
- Gilead Sciences, Inc (GILD) — sold 200 shares and closed position
- Valero Energy Corporation (VLO) — sold 150 shares and closed position
- Virtus Artificial Intelligence & Technology Opportunities Fund (AIO) — added 400 shares and increased position to 1,200 shares
- American States Water Company (AWR) — added 15 shares and increased position to 200 shares
- BlackRock Science and Technology Trust (BST) — added 200 shares and increased position to 600 shares
- Cummins Inc (CMI) — added 50 shares and increased position to 100 shares
- Cisco Systems, Inc (CSCO) — added 100 shares and increased position to 300 shares
- The Home Depot, Inc (HD) — added 30 shares and increased position to 100 shares
- Honeywell International Inc (HON) — added 30 shares and increased position to 100 shares
- Intel Corporation (INTC) — added 80 shares and increased position to 280 shares
- Illinois Tool Works Inc (ITW) — added 40 shares and increased position to 100 shares
- QUALCOMM Incorporated (QCOM) — added 30 shares and increased position to 100 shares
- Starbucks Corporation (SBUX) — added 60 shares and increased position to 200 shares
-
Sempra (SRE) — added 30 shares and increased position of to 80 shares
- Johnson & Johnson (JNJ) — sold 50 shares and reduced position to 76 shares
- JPMorgan Chase & Co (JPM) — sold 110 shares and reduced position to 100 shares
- National Retail Properties, Inc (NNN) — sold 25 shares and reduced position to 200 shares
- Pinnacle West Capital Corporation (PNW) — sold 50 shares and reduced position to 200 shares
- Public Storage (PSA) — sold 15 shares and reduced position to 45 shares
- Tyson Foods, Inc (TSN) — sold 50 shares and reduced position to 100 shares
- UnitedHealth Group Incorporated (UNH) — sold 20 shares and reduced position to 40 shares
I covered these transactions in monthly reviews, so I won't
rehash details here.

From left to right, the colors represent Borderline Safe, Safe, and Very Safe dividend safety scores. I no longer own Unsafe or Very Unsafe dividend growth stocks.
DivGro now contains 92 different positions. Of these, 84 are
dividend growth stocks, five are dividend-paying stocks, and
six are CEFs (closed-end funds). I also own four stocks that
do not pay dividends.
Here is the distribution of DivGro's stock holdings by
sector:

I also look at the distribution of my stocks by Super Sector:

Market Value
At the end of Q3-2022, DivGro's market value represented a simple gain of 94% on the total amount invested. Of course, this does not consider the timing and size of cash deposits and withdrawals. DivGro's IRR (internal rate of return) since inception is 12.1%, which is a better measure of portfolio performance.
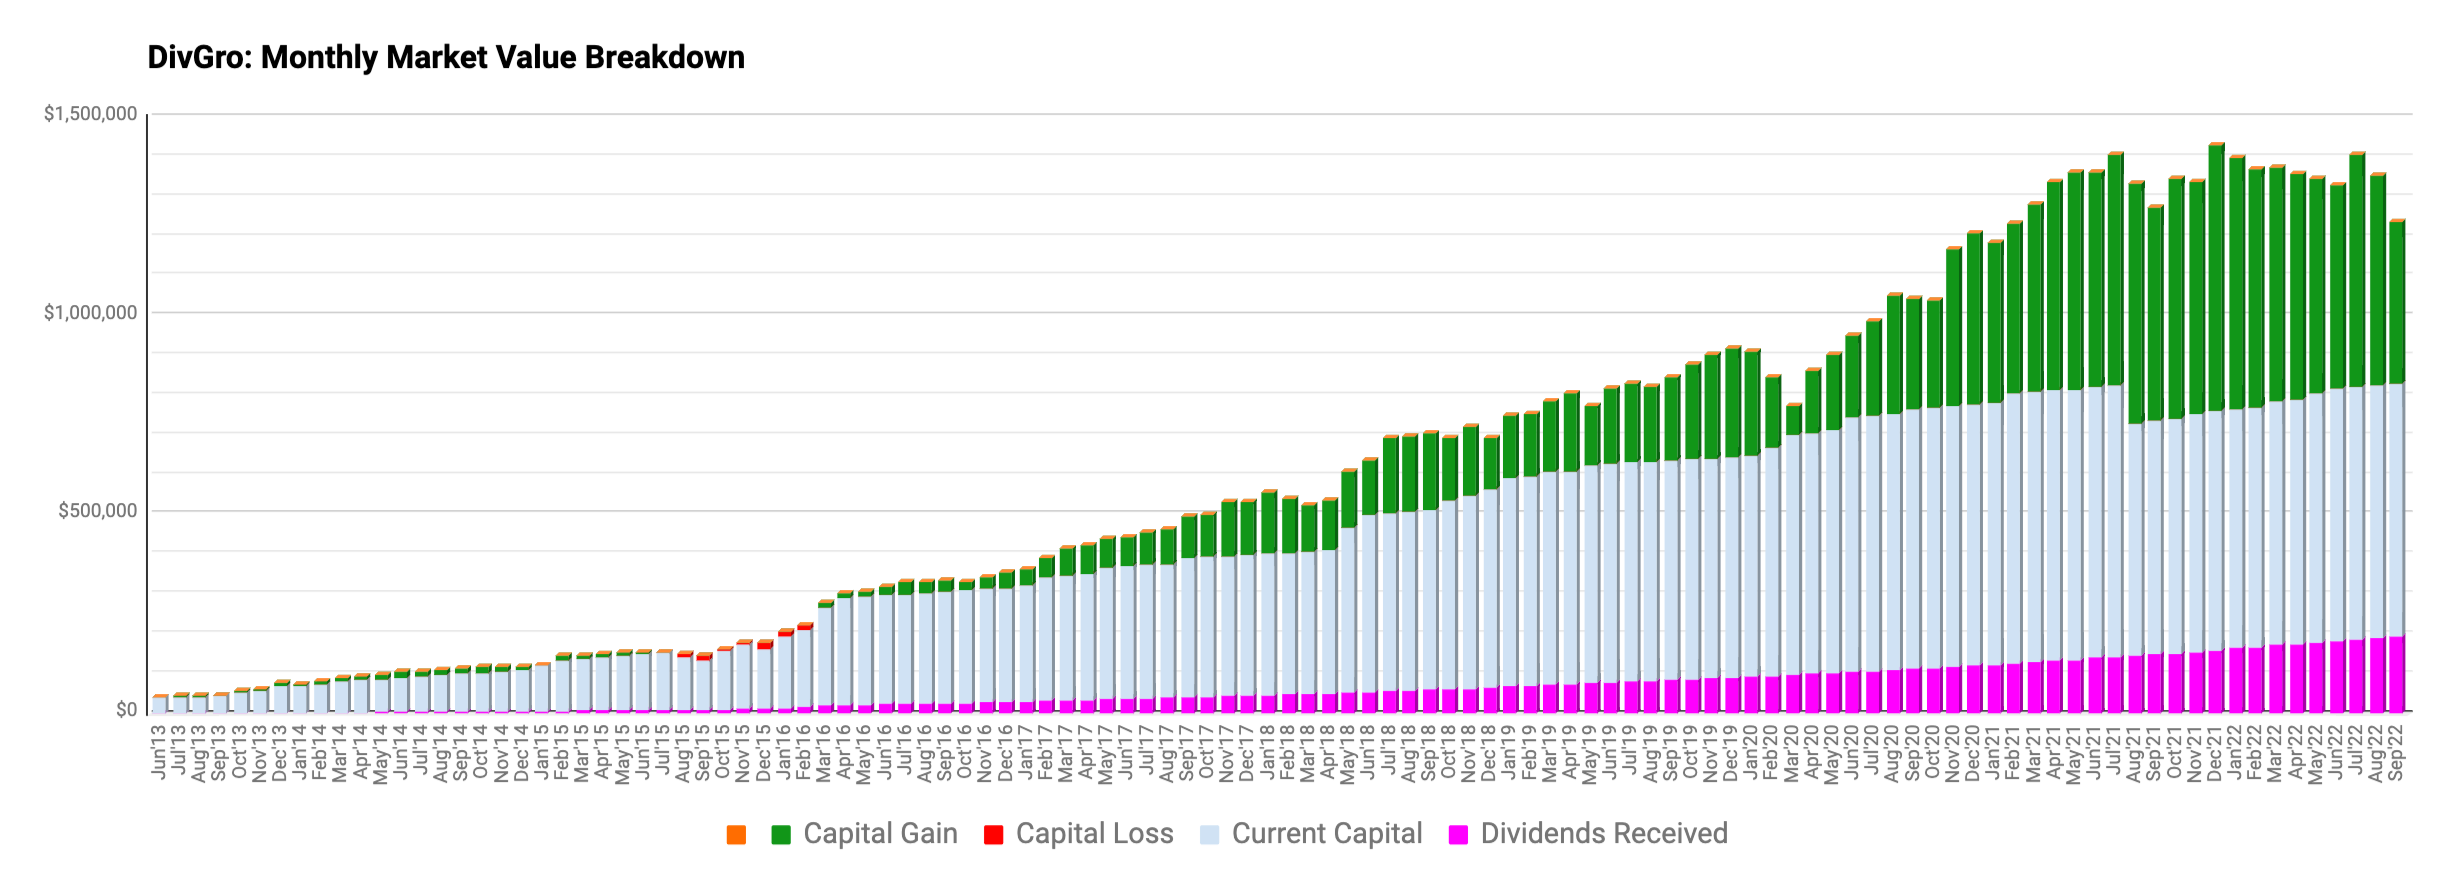
Q3-2022 certainly was tough on DivGro!
Portfolio Statistics
In quarterly reviews, I like to present general portfolio statistics.
First, consider the weight of individual holdings in DivGro:
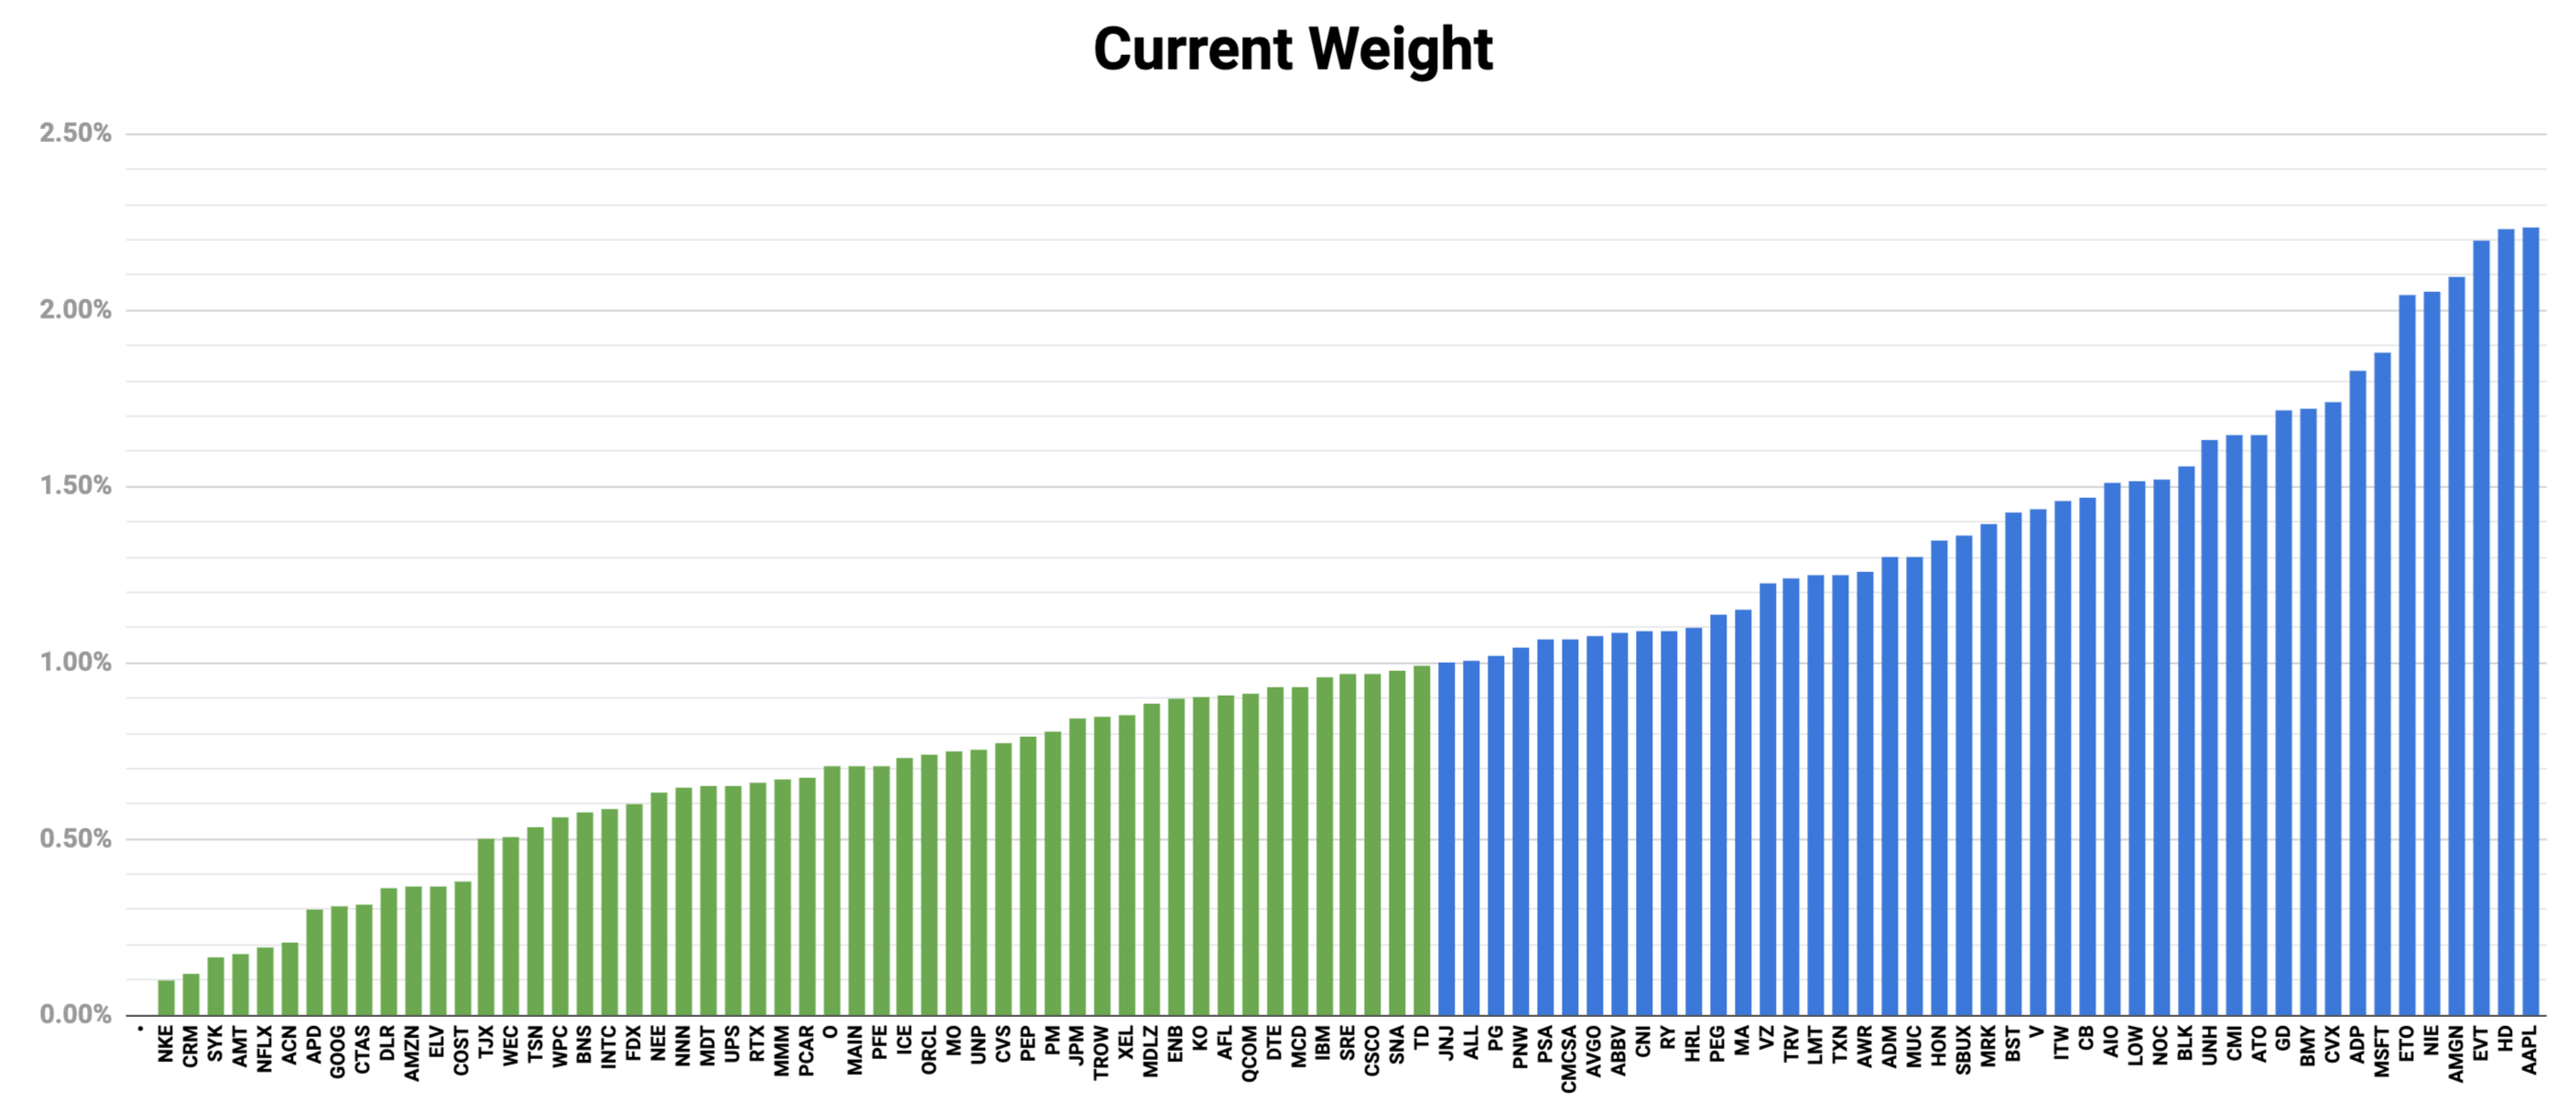
AAPL is the largest position in my portfolio, followed by
HD and EVT. On the other hand, NKE, Salesforce,
Inc (CRM), and Stanley Black & Decker (SWK) are the smallest positions in DivGro
Last year, I reworked my system for determining the target weights of positions in DivGro.
The system is dynamic and flexible and allows me to calibrate factors when my goals change. Here is a chart showing the current and target weights of dividend-paying stocks in DivGro:

I'm not really interested in trimming positions to bring them back into "compliance," especially for positions in my taxable account. Rather, I'll favor buying more shares of underweight positions to fill any gaps from below.
Next, let's look at the contribution of each position to DivGro's PADI, which depends not only on the stock's yield but also on the size of the investment.

If a position has an outsized contribution to PADI, a dividend cut will have
an outsized impact. While I invest in relatively safe dividend growth stocks,
I want to limit the potential damage of unexpected dividend cuts.
I've increased my investments in several closed-end funds (CEFs) significantly, to more than 27% of DivGro's PADI. This is a rather risky move, though one I'm willing to accept for the reward of higher-yielding investments. I only a few years left before retirement, so I'm hoping to collect more income now to expand my portfolio of dividend-paying positions in the near future. With rising interest rates, the chances of distribution cuts is high, as most of these CEFs use leverage to boost their distributions!
VZ is my largest single stock position by contribution to
PADI.
Here is a chart showing the distribution of dividend yields of stocks in my portfolio:

The top-yielding positions in DivGro are AIO, ETO, BST, NIE, MO, and EVT, with yields that range from 11.55% (AIO) down to 8.97% (EVT). Ordinarily, I don't like to see forward yields this high, but taking
on more risk is necessary given the current inflation rate of 8.2%.
The arithmetic average yield of dividend-paying stocks in my portfolio is
3.20%, while the position-weighted average yield is 3.08%. Although both of
these average yields are on the low side, I'm not too concerned because
DivGro's average dividend growth rate is relatively high, and stocks often
appreciate nicely with dividend increases.
Yield on Cost (YoC) provides another perspective, effectively representing a stock's (initial) dividend yield and its dividend growth since acquisition. I've owned MAIN the longest, so it is not surprising that its YoC is above 13%.

Let's look at the payback percentage, or how much of my original
investment I've received back as dividends. Generally, stocks I've owned
for a long time will have larger paybacks, but dividend yield also plays a
role: payback will grow faster for stocks with larger yields.

MAIN is my oldest position, and with a payback of 106.25%, it
has by far the largest payback in my portfolio! I'm happy to now have my
first position return more in dividends than I've invested in the
position! NIE is the second highest with 41.71%.
Through the first nine months of 2022, the S&P 500 index lost 23.9%, and DivGro certainly was not
spared!
Here is a chart showing DivGro's year-over-year performance:

Netflix, Inc (NFLX) and INTC have been the worst performers over the past year, with share prices
dropping of 61.5% and 51.6%, respectively. In contract, CVX and ADM have performed the best, with returns of 41.6% and 34.6%, respectively.
One way to identify potentially undervalued positions is to compare the
current forward yield to the 5-year average yield. Discounted stocks
(relative to historical yields) are colored green:

Presently, FDX and CMCSA appear to offer
the best opportunities for additional investment. Based on how I determine target weights, I need to add 86 shares to my CMCSA position, and 18 shares to my FCX
position to turn them into full-sized positions.
Concluding Remarks
I'll planning on favoring higher-yielding stocks at the cost of some risk. Nevertheless, I'll be buying the highest-quality stocks available when they're trading at favorable valuations. I need to increase my exposure to the Cyclical sectors and decrease my exposure to the Sensitive sectors to reach an equilibrium between the three supersectors.
You can now follow me on Twitter and Facebook.
No comments :
Post a Comment
Please don't include links in comments. I will mark such comments as spam and the comment won't be published. To make me aware of your blog or website, comment on my Blogrole page instead.