
Welcome to the September review of DivGro, my portfolio of dividend growth stocks. My goal with these reviews is to share updates to my portfolio and to detail the dividends I received during the month. I also look at how DivGro's projected annual dividend income (PADI) has changed.
In September, I added shares to one existing position, and ten DivGro stocks announced dividend increases in September. As a result, DivGro's PADI increased by about 1.1% in September. Year over year, PADI increased by 24.3%.
September is a quarter-ending month, which often produces significant dividend income totals and often new monthly records. While I received dividend income totaling $5,803 in September, it is not a new monthly record. The reason is that I received several large special dividends in January, and that monthly record of $6,023 still stands.

Assuming the status quo and given DivGro's PADI of $45,683, I can expect to receive $3,807 in dividend income per month, on average, in perpetuity. Of course, most of the stocks I own are dividend growers, so I expect my dividend income to increase over time! Furthermore, I plan to reinvest dividends until I retire, so DivGro's PADI should continue to grow through dividend growth and through compounding.
Dividend Income
In September, I received a total of $5,803 in dividend income from 52 different stocks:
Following is a list of the dividends I collected in September:
- Archer-Daniels-Midland Company (ADM) — income of $80.00
- Aflac Incorporated (AFL) — income of $80.00
- Virtus Artificial Intelligence & Technology Opportunities Fund (AIO) — income of $180.00
- Amgen Inc (AMGN) — income of $223.10
- Atmos Energy Corporation (ATO) — income of $136.00
- Broadcom Inc (AVGO) — income of $123.00
- American States Water Company (AWR) — income of $79.50
- BlackRock, Inc (BLK) — income of $170.80
- BlackRock Science and Technology Trust (BST) — income of $150.00
- Cummins Inc (CMI) — income of $157.00
- Cintas Corporation (CTAS) — income of $11.50
- Chevron Corporation (CVX) — income of $213.00
- Digital Realty Trust, Inc (DLR) — income of $54.90
- Anthem, Inc (ELV) — income of $12.80
- Enbridge Inc (ENB) — income of $195.96
- Eaton Vance Tax-Advantaged Global Dividend Opportunities Fund (ETO) — income of $224.00
- Eaton Vance Tax-Advantaged Dividend Income Fund (EVT) — income of $203.25
- The Home Depot, Inc (HD) — income of $190.00
- Honeywell International Inc (HON) — income of $98.00
- International Business Machines Corporation (IBM) — income of $165.00
- Intercontinental Exchange, Inc (ICE) — income of $38.00
- Intel Corporation (INTC) — income of $102.20
- Johnson & Johnson (JNJ) — income of $85.88
- Lockheed Martin Corporation (LMT) — income of $112.00
- Main Street Capital (MAIN) — income of $81.90
- McDonald's Corporation (MCD) — income of $69.00
- 3M Company (MMM) — income of $111.75
- Microsoft Corporation (MSFT) — income of $62.00
- BlackRock MuniHoldings California Quality Fund (MUC) — income of $55.00
- NextEra Energy, Inc (NEE) — income of $42.50
- Virtus Equity & Convertible Income Fund (NIE) — income of $625.00
- Northrop Grumman Corporation (NOC) — income of $69.20
- Realty Income Corporation (O) — income of $37.13
- PACCAR Inc (PCAR) — income of $34.00
- Public Service Enterprise Group Incorporated (PEG) — income of $135.00
- PepsiCo, Inc (PEP) — income of $69.00
- Pfizer Inc (PFE) — income of $80.00
- Pinnacle West Capital Corporation (PNW) — income of $212.50
- Public Storage (PSA) — income of $90.00
- QUALCOMM Incorporated (QCOM) — income of $75.00
- Raytheon Technologies Corporation (RTX) — income of $55.00
- Snap-on Incorporated (SNA) — income of $85.20
- The TJX Companies, Inc (TJX) — income of $29.50
- T Rowe PriceT. Rowe Price Group, Inc (TROW) — income of $120.00
- The Travelers Companies, Inc (TRV) — income of $93.00
- Tyson Foods, Inc (TSN) — income of $46.00
- UnitedHealth Group Incorporated (UNH) — income of $66.00
- Union Pacific Corporation (UNP) — income of $62.40
- United Parcel Service, Inc (UPS) — income of $76.00
- Visa Inc (V) — income of $37.50
- Valero Energy Corporation (VLO) — income of $147.00
- WEC Energy Group (WEC) — income of $50.93
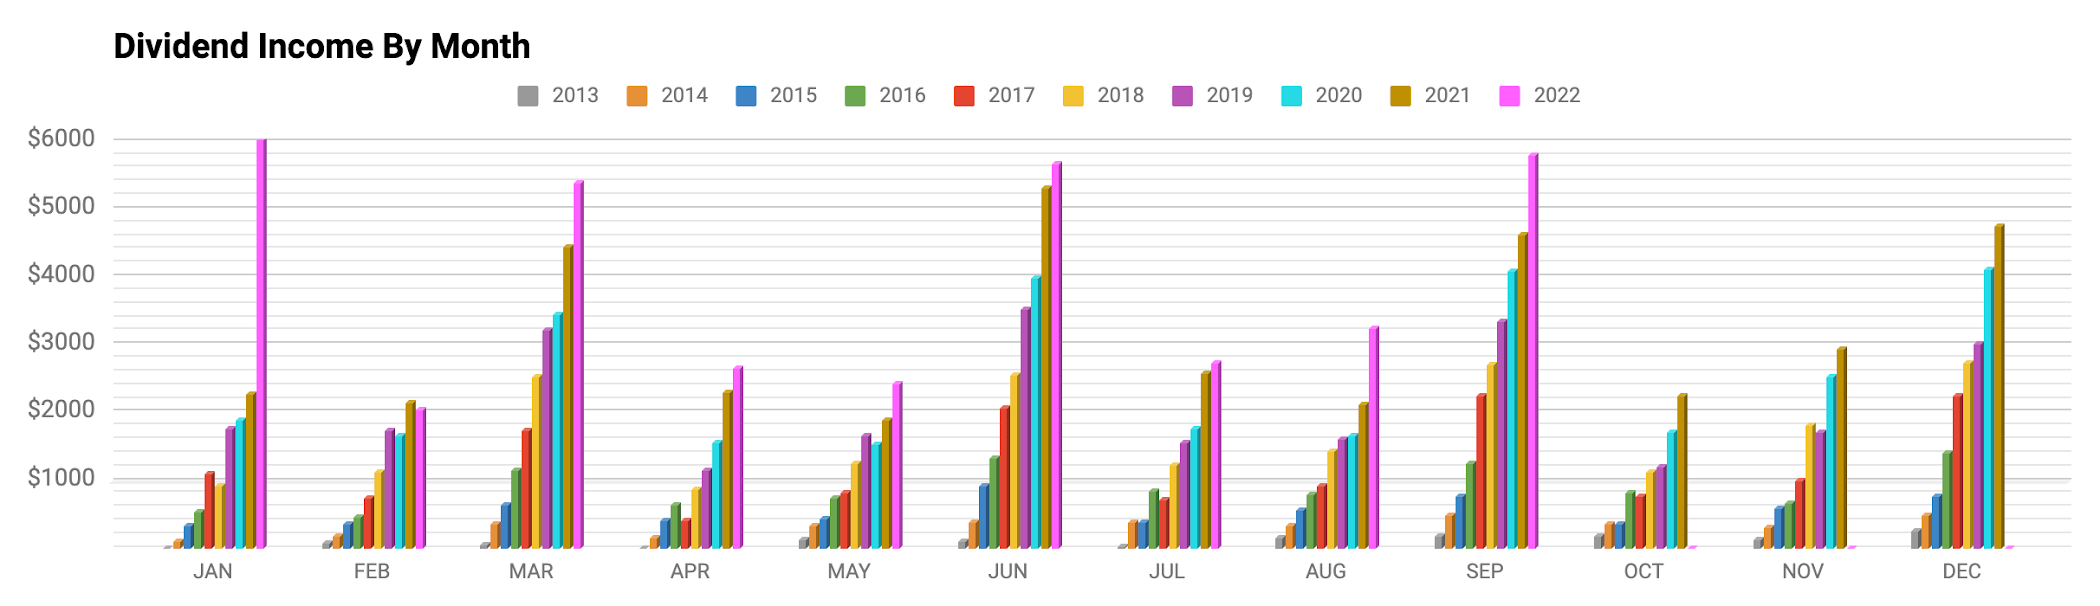
Here is a chart showing DivGro's monthly dividends plotted against PMDI. It is clear that quarter-ending months are huge outliers:

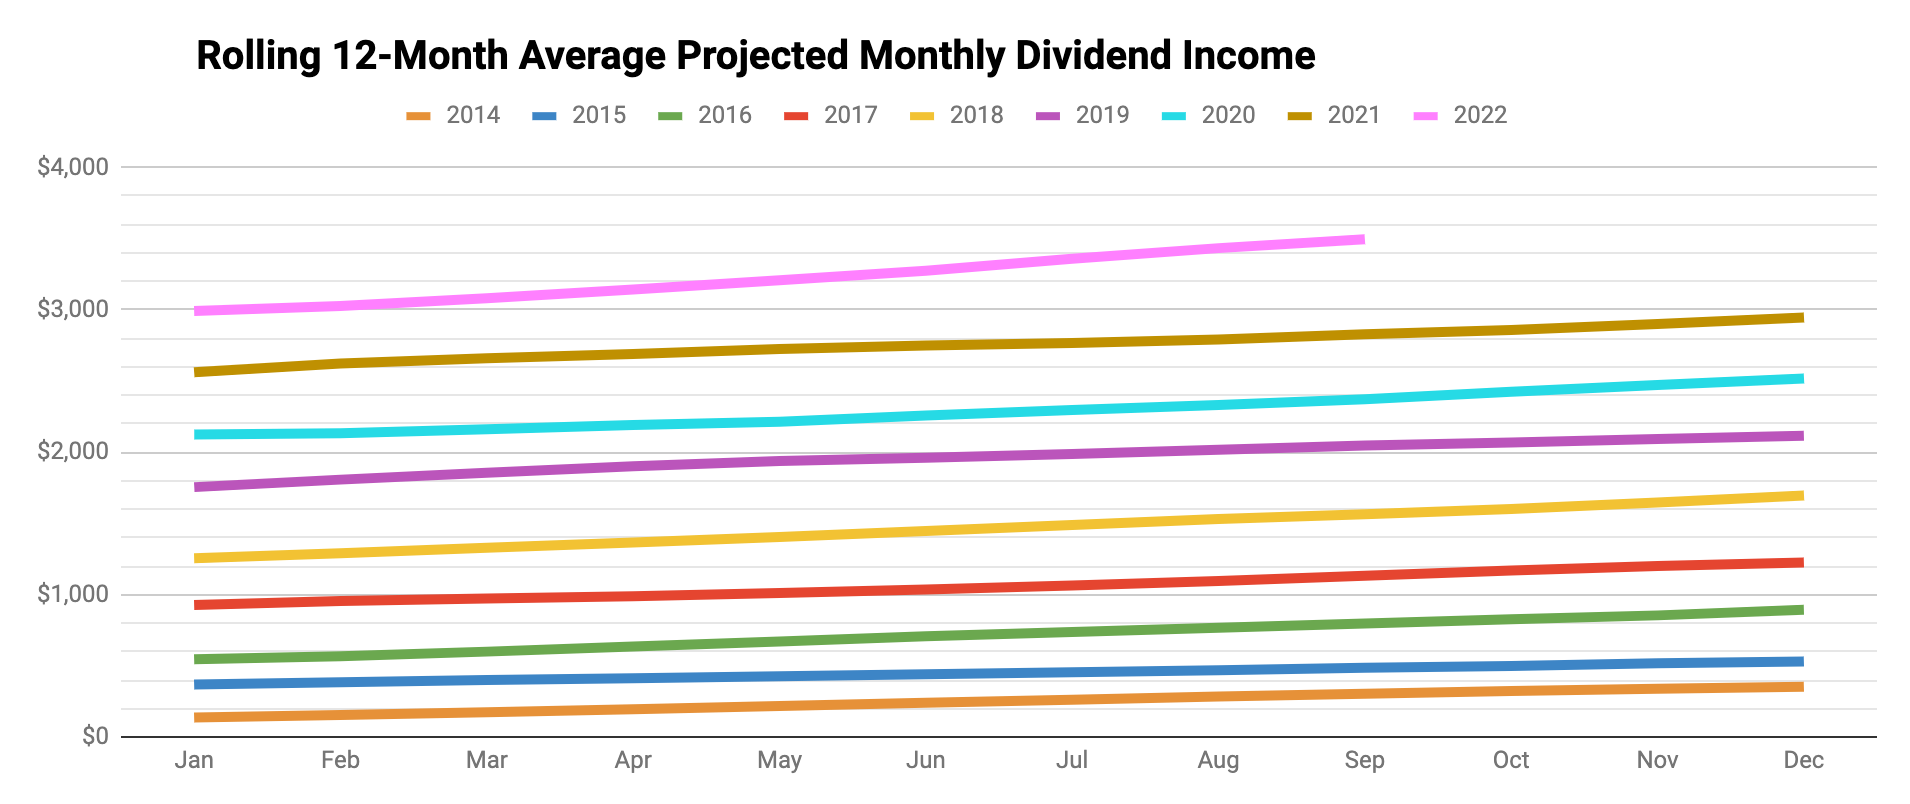
For this reason, I now create a rolling 12-month average of dividends received (the orange bars) plotted against a rolling 12-month average of PMDI (the blue, staggered line):
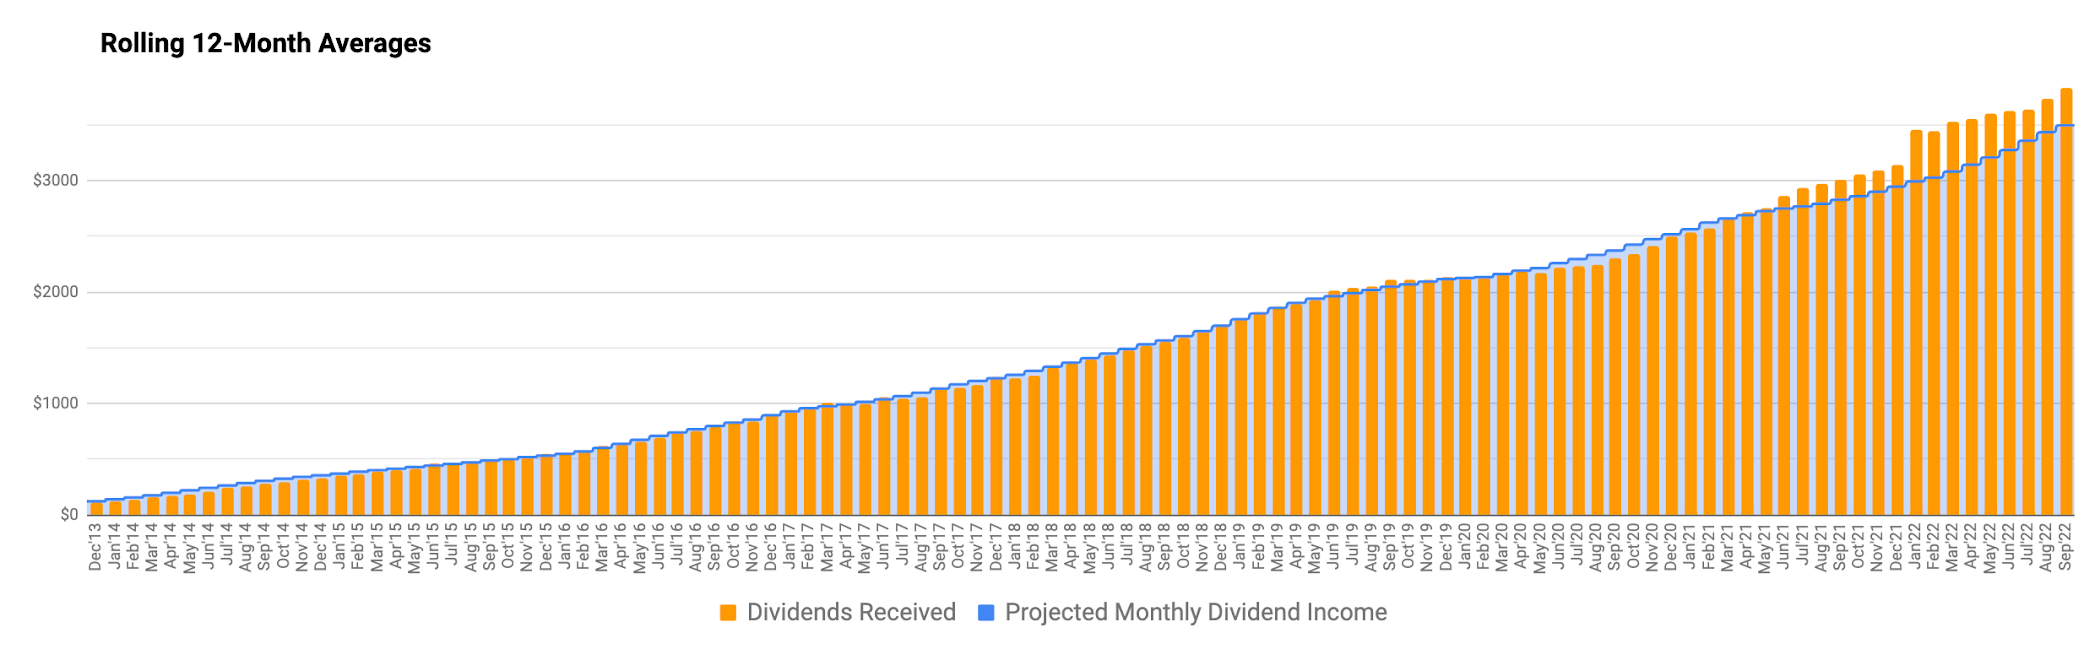
The reason the orange bars are tracking above the blue, staggered line, is special dividends. These are not included in PMDI but do contribute to DivGro's total dividend income received.
Dividend Changes
In September, the following stocks announced dividend increases, or paid higher dividends due to exchange-rate fluctuations:
- Accenture plc (ACN) — increase of 15.46%
- American Tower Corporation (AMT) — increase of 2.80%
- Honeywell International Inc (HON) — increase of 5.10%
- Lockheed Martin Corporation (LMT) — increase of 7.14%
- Microsoft Corporation (MSFT) — increase of 9.68%
- Realty Income Corporation (O) — increase of 0.20%
- Philip Morris International Inc (PM) — increase of 1.60%
- Starbucks Corporation (SBUX) — increase of 8.16%
- Texas Instruments Incorporated (TXN) — increase of 7.83%
- Verizon Communications Inc (VZ) — increase of 1.95%
As a result of these changes, DivGro's PADI will increase by $150.
I like seeing dividend increases above 7%, and five of the ten increases top my expectations. The arithmetic average of this month's dividend increases is 5.99%, which does not quite beat the current inflation rate of 8.2%:

Transactions
Here is a summary of my transactions in September:
- BlackRock MuniHoldings California Quality Fund (MUC) — added 500 shares and increased position to 1,500 shares
This transaction increased DivGro's PADI by about $330.
From my August Review:
I've been increasing my exposure to higher-yielding closed-end funds (CEFs). I opened a position in MUC, a muni CEF yielding 5.85%. Muni income is exempt from federal taxes, and I'll receive additional state tax benefits because I reside in California. The taxable equivalent yield (Yte) depends on one's federal tax rate:
10% bracket: Yte = 5.85% ÷ (1 − 10%) = 6.50%
12% bracket: Yte = 5.85% ÷ (1 − 12%) = 6.65%
22% bracket: Yte = 5.85% ÷ (1 − 22%) = 7.50%
24% bracket: Yte = 5.85% ÷ (1 − 24%) = 7.80%
32% bracket: Yte = 5.85% ÷ (1 − 32%) = 8.60%
35% bracket: Yte = 5.85% ÷ (1 − 35%) = 9.00%
37% bracket: Yte = 5.85% ÷ (1 − 37%) = 9.29%
I'm planning on increasing my MUC position to somewhat match those of the other CEFs I own: AIO, BST, ETO, EVT, and NIE.
While it is risky to have six CEFs contribute more than 27% of DivGro's PADI, I'm intentional with this strategy. With only a few years left before retirement, I need to increase my annual dividend income and boost reinvestment opportunities to expand my portfolio positions.
Some CEFs use leverage to boost distributions. When interest rates rise, the cost of leverage also rises, and it becomes harder for CEFs to pay generous distributions. A prolonged period of high short-term interest rates (and especially when the yield curve inverts) may cause the earnings of a CEF to decrease so much that a distribution cut becomes inevitable.
Unfortunately, MUC reduced its distribution by 20% on 3 October, so I'll need to decide if future investments would be wise. I'll report more on this distribution cut in my October review, and its impact on DivGro's PADI.
Portfolio Diversification
I'm slowly rebalancing DivGro between Defensive, Sensitive, and Cyclical supersectors. Below is a chart showing the current distribution with an insert of last month's distribution.


Markets
September usually is the worst performing month for the stock market and last month's performance is no exception! In fact, the S&P 500 fell by more than 9% in September 2022, its worst September performance since 2002. All three major indexes are solidly in bear market territory now, having fallen more than 20% each from their highs.
Here is a summary of various market indicators, showing the changes over the last month:
|
DOW 30 |
S&P 500 |
NASDAQ Composite |
10-YR BOND |
CBOE VIX |
|
| Aug 31, 2022 | 31,510.43 | 3,955.00 | 11,816.20 | 3.133 | 25.87 |
| Sep 30, 2022 | 28,725.51 | 3,585.62 | 10,575.62 | 3.804 | 31.62 |
In September, the DOW 30 dropped 8.8%, the S&P 500 dropped 9.3%, and the NASDAQ dropped 10.5%. The yield on the benchmark 10-year Treasury note rose to 3.804%, while CBOE's measure of market volatility, the VIX, increased by 22.2% to 31.62.
It is unsurprising that DivGro also performed poorly in September. Here is a chart showing how the stocks and funds in my portfolio performed over the past month:


Portfolio Statistics
Given DivGro's current market value and the total capital invested, the portfolio has returned about 94% since inception. But calculating the IRR (internal rate of return) gives a better measure of portfolio performance, as IRR considers the timing and size of deposits since inception. DivGro's IRR is 12.1%.
I track the yield on cost (YoC) for individual stocks, as well as an average YoC for my portfolio. DivGro's average YoC increased from 4.29% last month to 4.31% this month.
Percentage payback relates dividend income to the amount of capital invested. DivGro's average percentage payback is 30.6%, up from last month's 29.7%.
Finally, DivGro's projected annual yield is at 7.17%, up from last month's value of 7.10%. I calculate the projected annual yield by dividing PADI ($45,683) by the total amount invested.
Here's a chart showing DivGro's market value breakdown. Dividends are plotted at the base of the chart so we can see them grow over time:

Looking Ahead
I'm curious to see what the final quarter of 2022 will bring! This year has been challenging and concerns about inflation, the war in Ukraine, energy costs, global supply chain problems, and a probable recession, are all continuing to weigh on the markets.
Please see my Performance page for various visuals summarizing DivGro's performance.
You can now follow me on Twitter and Facebook.
No comments :
Post a Comment
Please don't include links in comments. I will mark such comments as spam and the comment won't be published. To make me aware of your blog or website, comment on my Blogrole page instead.