
I'm a little behind on my monthly reviews! It's December already, but I'm only now reviewing DivGro's activities in October!
The goal of my monthly reviews is to share updates I've made to the portfolio and to provide a summary of dividends collected. I also look at how the month's activities have impacted DivGro's projected annual dividend income (PADI).
In October, I added shares to two existing positions, and seven DivGro stocks announced dividend increases in October, while one closed-end fund (CEF) I own announced a distribution cut. Additionally, I own some stocks that issue dividends in CAD (Canadian Dollars), and recent payments actually lowered PADI due to the impact of exchange-rate fluctuations. The net result of these changes is that PADI increased by about 0.7% in October and 24.1 year-over-year.
As for dividend income, in October, I received dividends totaling $3,064 from 31 stocks in my portfolio, a year-over-year increase of 36%. So far in 2022, I've collected $39,120 in dividends, or about 91% of my 2022 goal of $43,200.
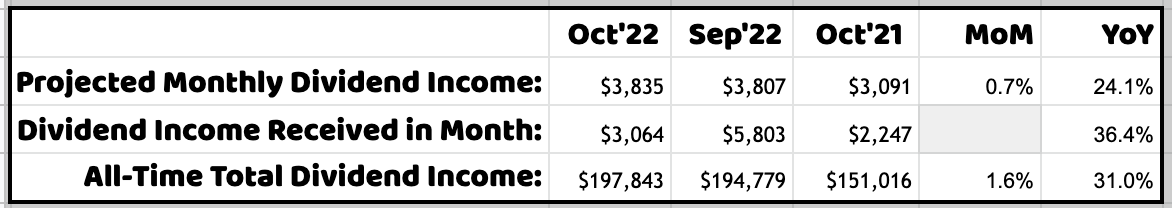
DivGro's PADI now stands at $46,015, which means I can expect to receive $3,835 in dividend income per month, on average, in perpetuity, assuming the status quo is maintained.
Of course, I expect the companies I've invested in not only to continue to pay dividends but to increase them over time! Also, until I retire, I hope to continue to reinvest dividends, so DivGro's PADI should continue to grow through dividend growth and through compounding.
Dividend Income
I collected dividends totaling $3,064 from 31 different stocks in October:
Here is a list of the dividends I received in October:
- Automatic Data Processing, Inc (ADP) — income of $104.00
- Virtus Artificial Intelligence & Technology Opportunities Fund (AIO) — income of $180.00
- The Allstate Corporation (ALL) — income of $85.00
- American Tower Corporation (AMT) — income of $14.70
- The Bank of Nova Scotia (BNS) — income of $114.02
- BlackRock Science and Technology Trust (BST) — income of $150.00
- Chubb Limited (CB) — income of $83.00
- Comcast Corporation (CMCSA) — income of $121.50
- Canadian National Railway Company (CNI) — income of $67.02
- Cisco Systems, Inc (CSCO) — income of $114.00
- DTE Energy Company (DTE) — income of $88.50
- Eaton Vance Tax-Advantaged Global Dividend Opportunities Fund (ETO) — income of $224.00
- Eaton Vance Tax-Advantaged Dividend Income Fund (EVT) — income of $203.25
- FedEx Corporation (FDX) — income of $57.50
- Illinois Tool Works Inc (ITW) — income of $131.00
- JPMorgan Chase & Co (JPM) — income of $100.00
- The Coca-Cola Company (KO) — income of $88.00
- Main Street Capital (MAIN) — income of $57.20
- Mondelez International, Inc. (MDLZ) — income of $77.00
- Medtronic plc (MDT) — income of $68.00
- Altria Group, Inc (MO) — income of $216.20
- Merck & Co., Inc (MRK) — income of $138.00
- BlackRock MuniHoldings California Quality Fund (MUC) — income of $55.00
- NIKE, Inc (NKE) — income of $4.58
- Realty Income Corporation (O) — income of $37.20
- Oracle Corporation (ORCL) — income of $48.00
- Philip Morris International Inc (PM) — income of $152.40
- Sempra (SRE) — income of $91.60
- Stryker Corporation (SYK) — income of $6.95
- W. P. Carey Inc (WPC) — income of $106.10
- Xcel Energy Inc (XEL) — income of $80.44
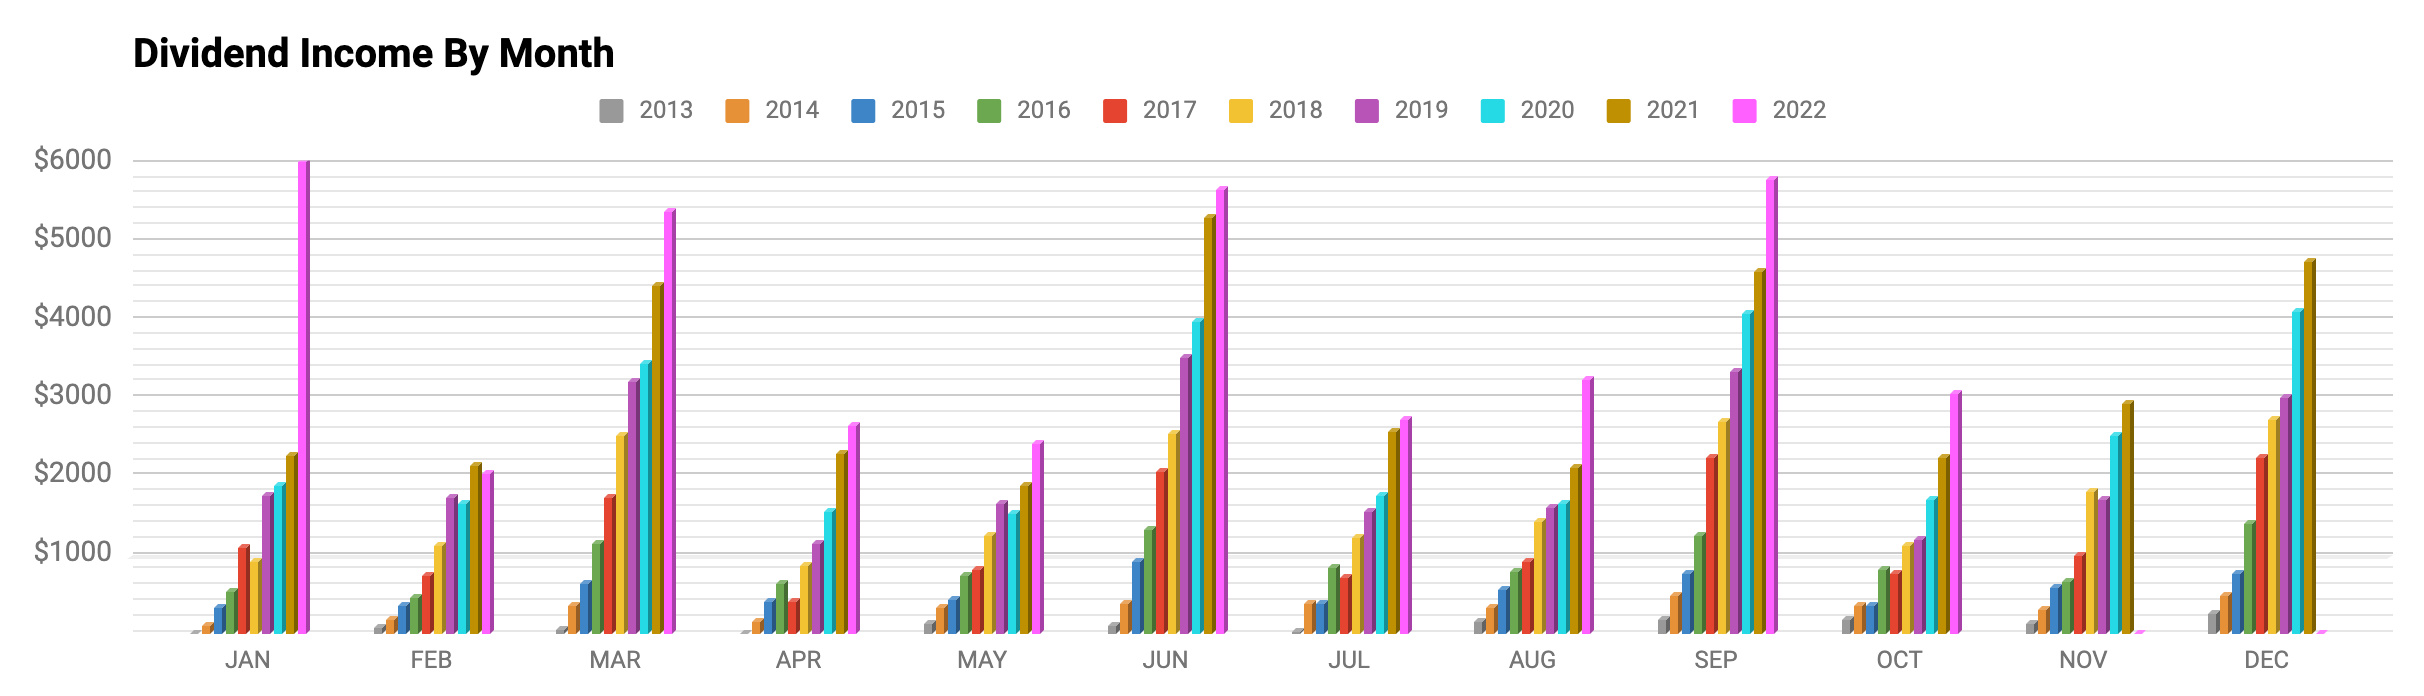
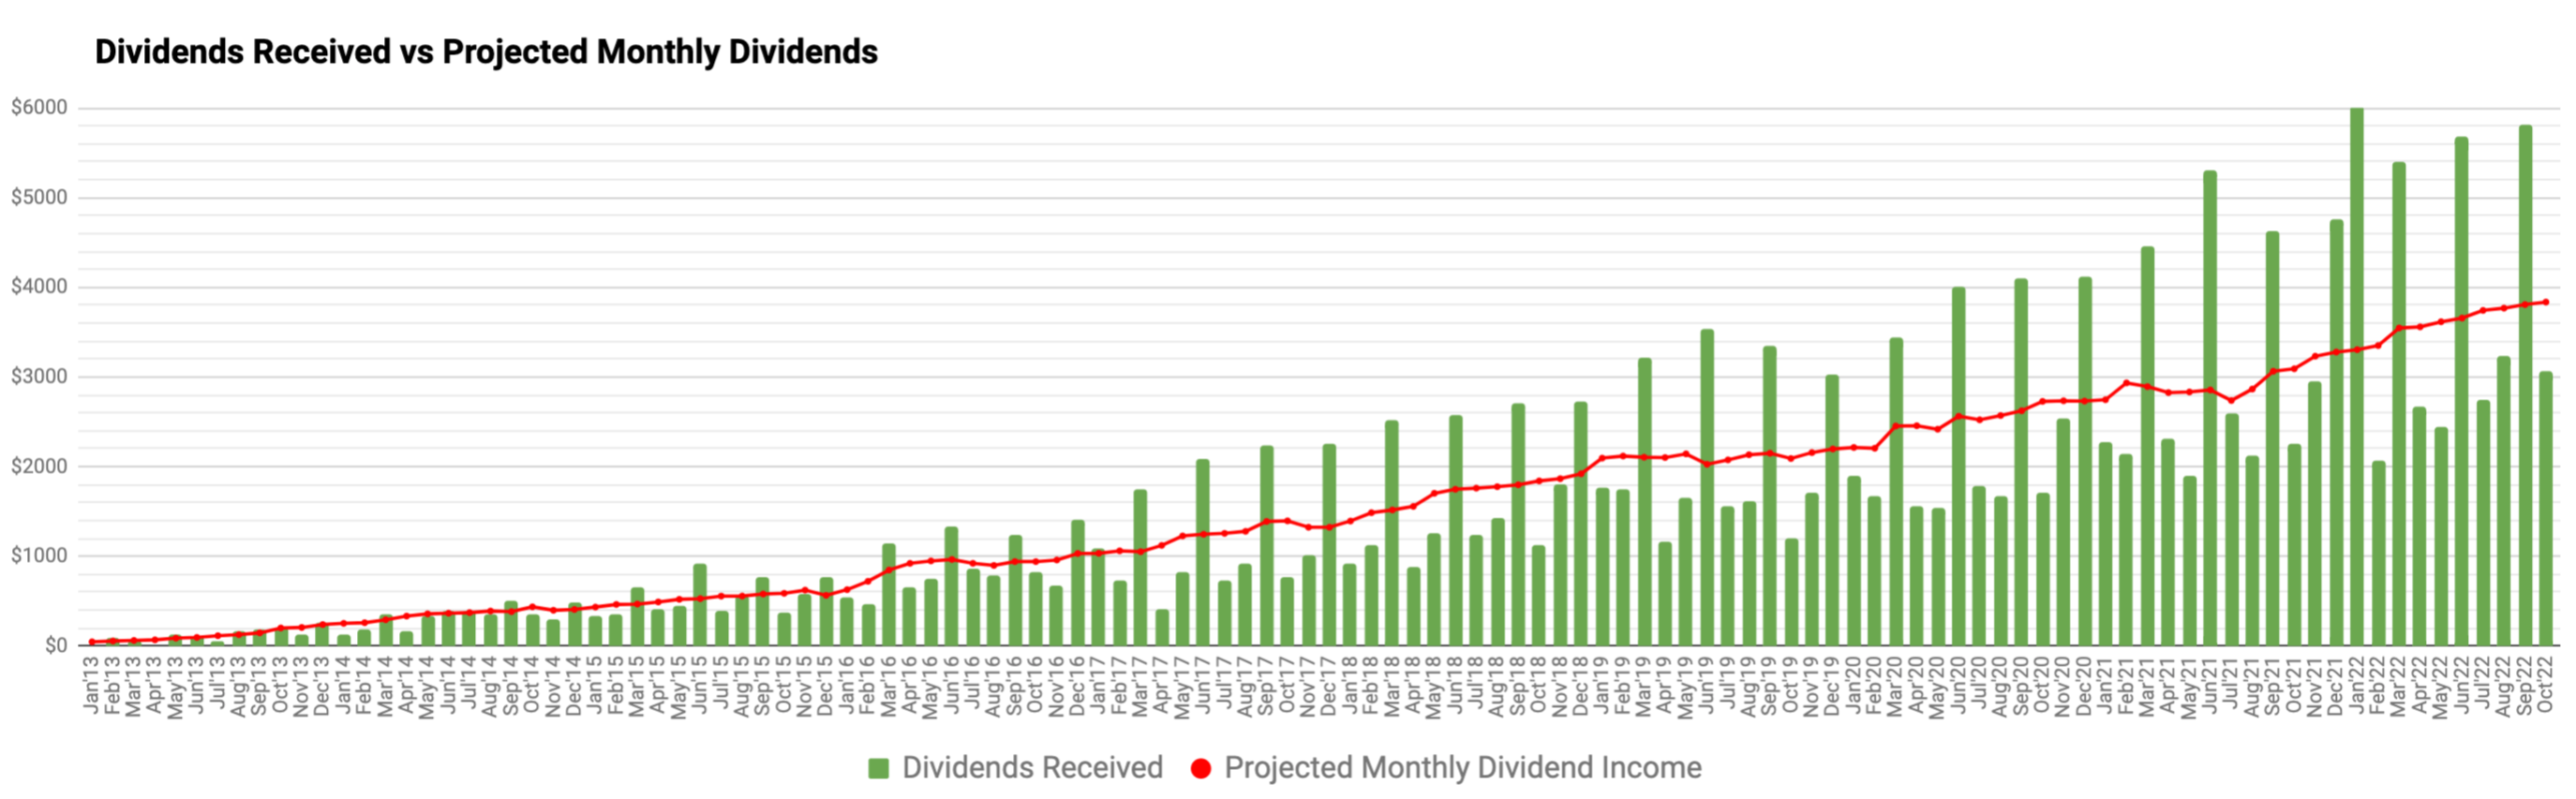
The following chart shows DivGro's monthly dividends plotted against PMDI. Quarter-ending months are huge outliers:
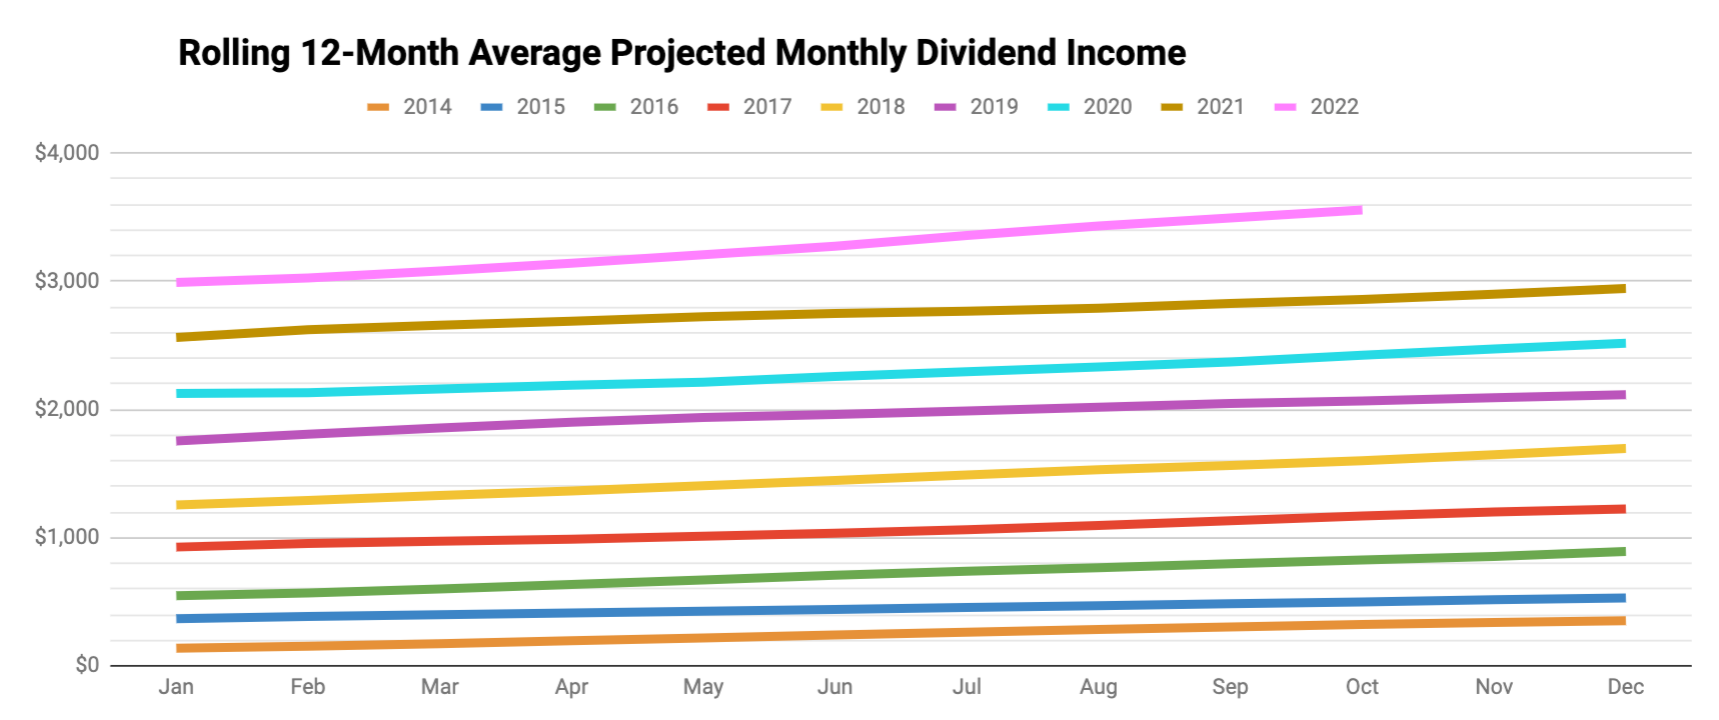
For this reason, I also create a rolling 12-month average of dividends received (the orange bars) plotted against a rolling 12-month average of PMDI (the blue, staggered line):
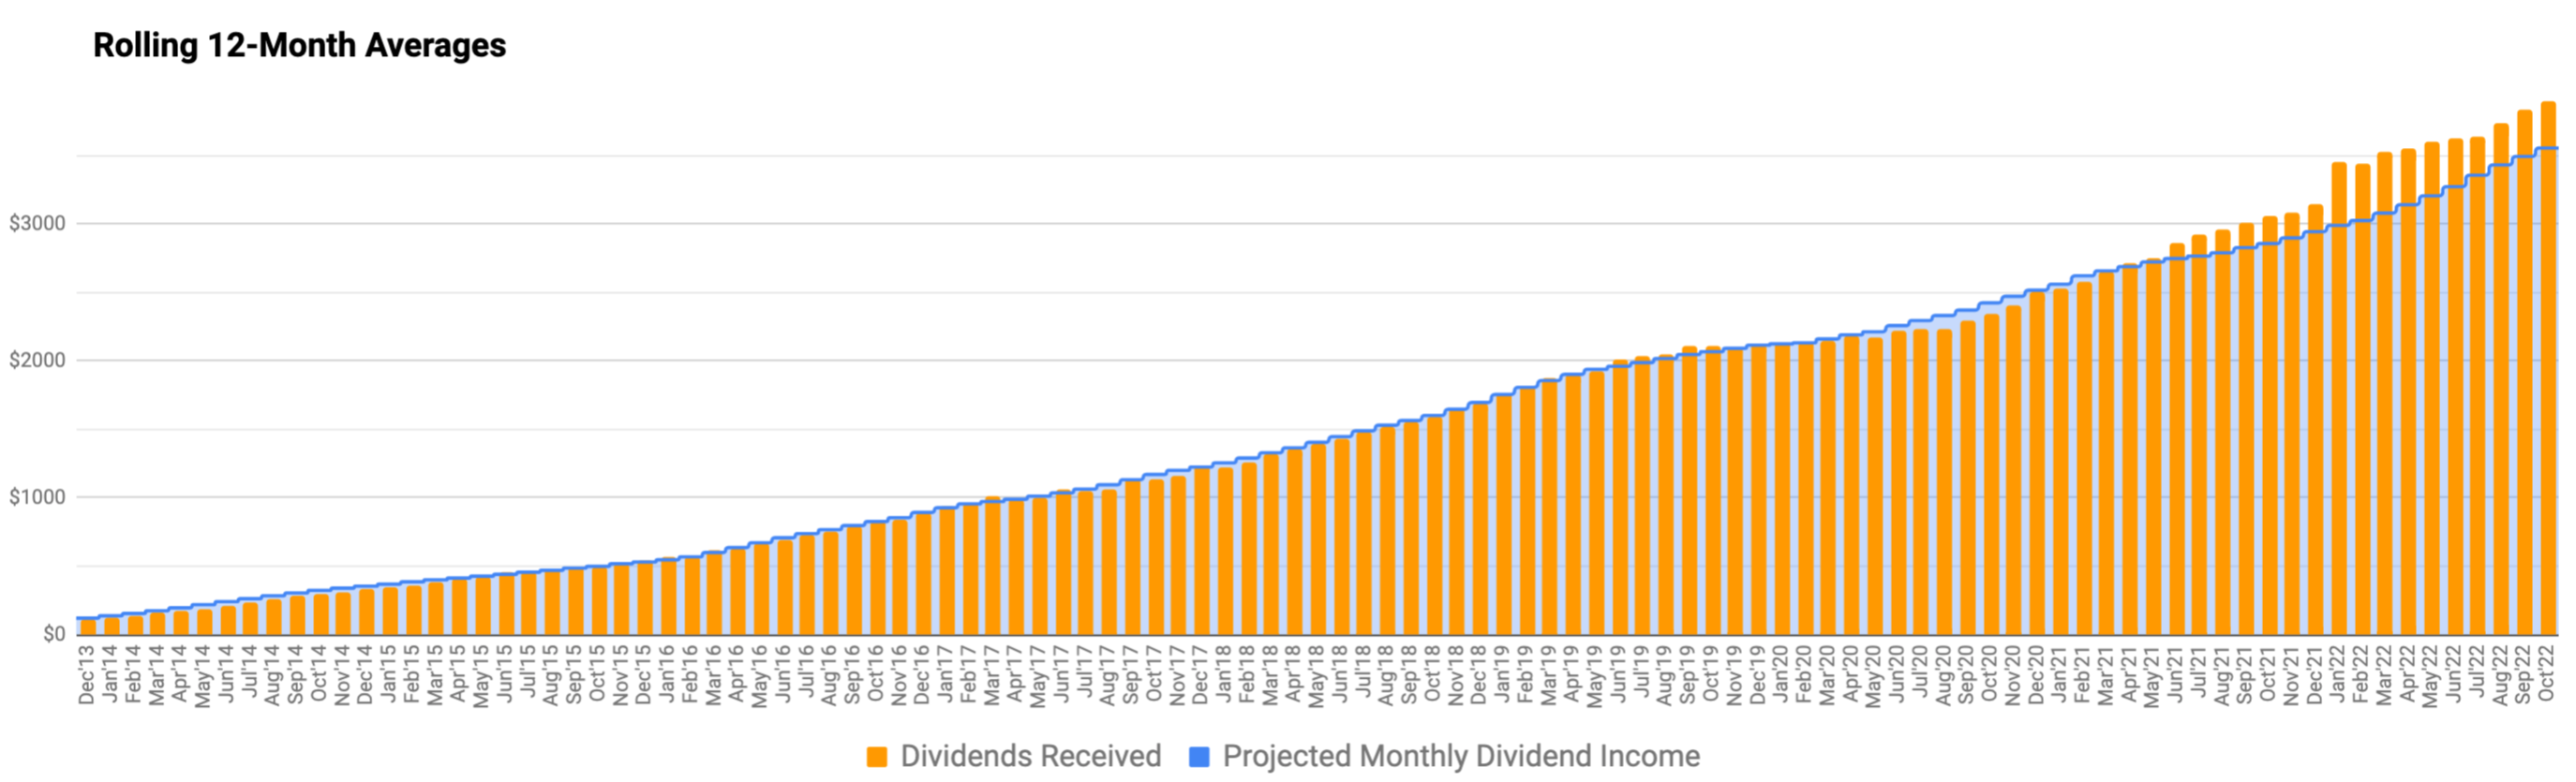
While it would be great if dividends were distributed more evenly, I don't want to change my investment decisions based on the timing or frequency of dividend payments.
The reason the orange bars are tracking above the blue, staggered line is special dividends. These are not included in PMDI but do contribute to DivGro's total dividend income received.
Dividend Changes
In October, the following stocks announced dividend increases:
- Visa Inc (V) — increase of 20.00%
- McDonald's Corporation (MCD) — increase of 10.14%
- Illinois Tool Works Inc (ITW) — increase of 7.38%
- AbbVie Inc (ABBV) — increase of 4.96%
- Main Street Capital (MAIN) — increase of 2.33%
- Pinnacle West Capital Corporation (PNW) — increase of 1.76%
- W. P. Carey Inc (WPC) — increase of 0.19%
- The Bank of Nova Scotia (BNS) — decrease of 4.82%
- Canadian National Railway Company (CNI) — decrease of 5.71%
- BlackRock MuniHoldings California Quality Fund (MUC) — decrease of 20.00%
These changes will decrease DivGro's PADI by about $237.
Transactions
Here is a summary of my transactions in October:
- American Tower Corporation (AMT) — added 40 shares and increased position to 50 shares
- Tyson Foods, Inc (TSN) — added 100 shares and increased position to 200 shares
These transactions increased DivGro's PADI by about $419.
AMT
After I opened a position in AMT in October 2021, I wrote:AMT was the top-ranked Real Estate sector stock in a recent article I wrote for TheStreet.com. Here is what I wrote about AMT:
Given its high 5-year DGR of 19.6%, AMT looks like an interesting candidate. Its 5-year yield on cost of 4.4% and high Chowder Number of 21 indicate strong dividend income and growth prospects. However, it is advisable to wait for a more favorable entry point. My risk-adjusted Buy Below price is $228. For investors willing to accept some risk, my fair value estimate of AMT is $252.
With AMT trading around $257 per share, the stock is trading at a premium to my Buy Below price of $228. Nevertheless, I wanted to open a small position in AMT so I can track the stock more diligently. As soon as AMT presents a better entry point, I'll increase my opening position!
Well, it's a year later, and AMT's stock price dropped more than enough to present "a better entry point". By adding 40 shares at $191.54, I reduced my average cost basis to a respectable $206.56. Currently, my risk-adjusted Buy Below price is $216, whereas AMT is trading at just over $219 per share.
My AMT position is not quite a full position yet, as I'm still short about 20 shares from my ideal target weight:

Portfolio Diversification
I'm slowly rebalancing DivGro between Defensive, Sensitive, and Cyclical supersectors. Below is a chart showing the current distribution with an insert of last month's distribution.

My exposure to the Sensitive and Cyclical sectors increased by 0.3% and 0.1%, respectively, whereas my exposure to the Defensive sector decreased by 0.4%.
Markets
After a terrible month in September, the market recovered nicely in October:
|
DOW 30 |
S&P 500 |
NASDAQ Composite |
10-YR BOND |
CBOE VIX |
|
| Sep 30, 2022 | 28,725.51 | 3,585.62 | 10,575.62 | 3.804 | 31.62 |
| Oct 31, 2022 | 32,732.95 | 3,871.98 | 10,988.15 | 4.052 | 25.88 |
In October, the DOW 30 increased by 13.95%, the S&P 500 increased by 7.99%, and the NASDAQ increased by 3.90%. The yield on the benchmark 10-year Treasury note rose to 4.052%, while CBOE's measure of market volatility, the VIX, declined by 18% to 25.88.
I'm happy to say that DivGro also performed well in October! Here is a chart showing how the stocks and funds in my portfolio performed over the past month:


Portfolio Statistics
Given DivGro's current market value and the total capital invested, the portfolio has returned about 124% since inception. But calculating the IRR (internal rate of return) gives a better measure of portfolio performance, as IRR considers the timing and size of deposits since inception. DivGro's IRR is 14.6%.
I track the yield on cost (YoC) for individual stocks, as well as an average YoC for my portfolio. DivGro's average YoC decreased from 4.31% last month to 4.28% this month.
Percentage payback relates dividend income to the amount of capital invested. DivGro's average percentage payback is 31.1%, up from last month's 30.6%.
Finally, projected annual yield is calculated by dividing PADI ($46,015) by the total amount invested. DivGro's projected annual yield is at 7.22%, up from last month's value of 7.17%.
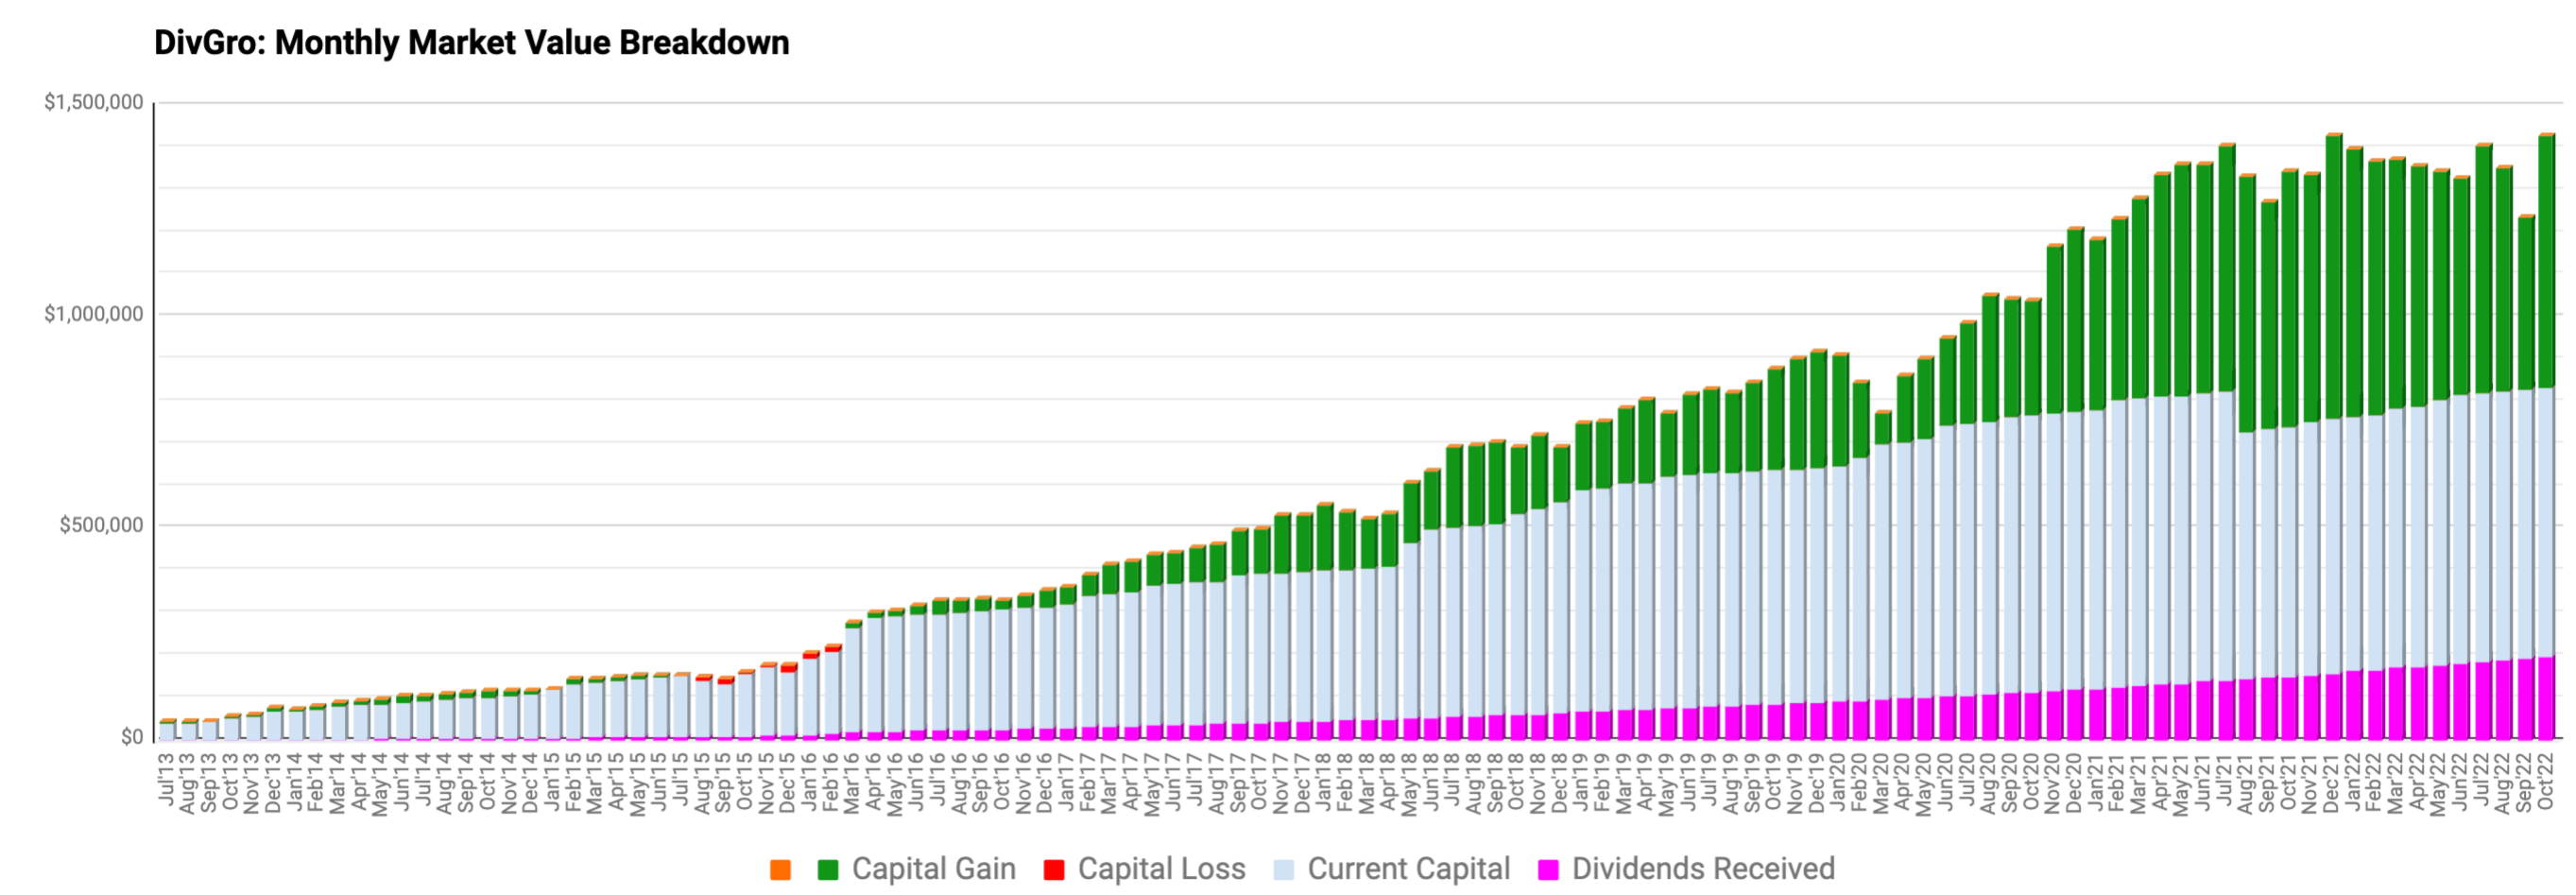
Here's a chart showing DivGro's market value breakdown. Dividends are plotted at the base of the chart so we can see them grow over time:

Looking Ahead

It's been difficult to keep up with DivGro and writing articles for Seeking Alpha and TheStreet.com, as I'm really busy at work! We're working hard on Elio, which is slated for release in 2024. Elio is about a boy who doesn’t really fit in, accidentally traveling across the galaxy and becoming an ambassador for Earth while among the aliens.
I'm happy to share that we've recently learned that we'll be grandparents for the fourth time! The baby is due in June 2023, and we wish my second son and his wife all the best with her pregnancy!
Meanwhile, James will turn two in December, and his new brother Adrian will be 3 months old in a few days. My youngest son and his wife are getting more sleep now, and I'm sure things will settle down soon enough.
My oldest son and his wife took Chloe (now fourteen months) to South Africa in August to meet our extended family. The great-grandparents were absolutely thrilled to meet her, as were the rest of the family. We accompanied them for part of the trip, which is why I did not write much in August.
Please see my Performance page for various visuals summarizing DivGro's performance.You can now follow me on Twitter and Facebook.
No comments :
Post a Comment
Please don't include links in comments. I will mark such comments as spam and the comment won't be published. To make me aware of your blog or website, comment on my Blogrole page instead.